
By the Numbers
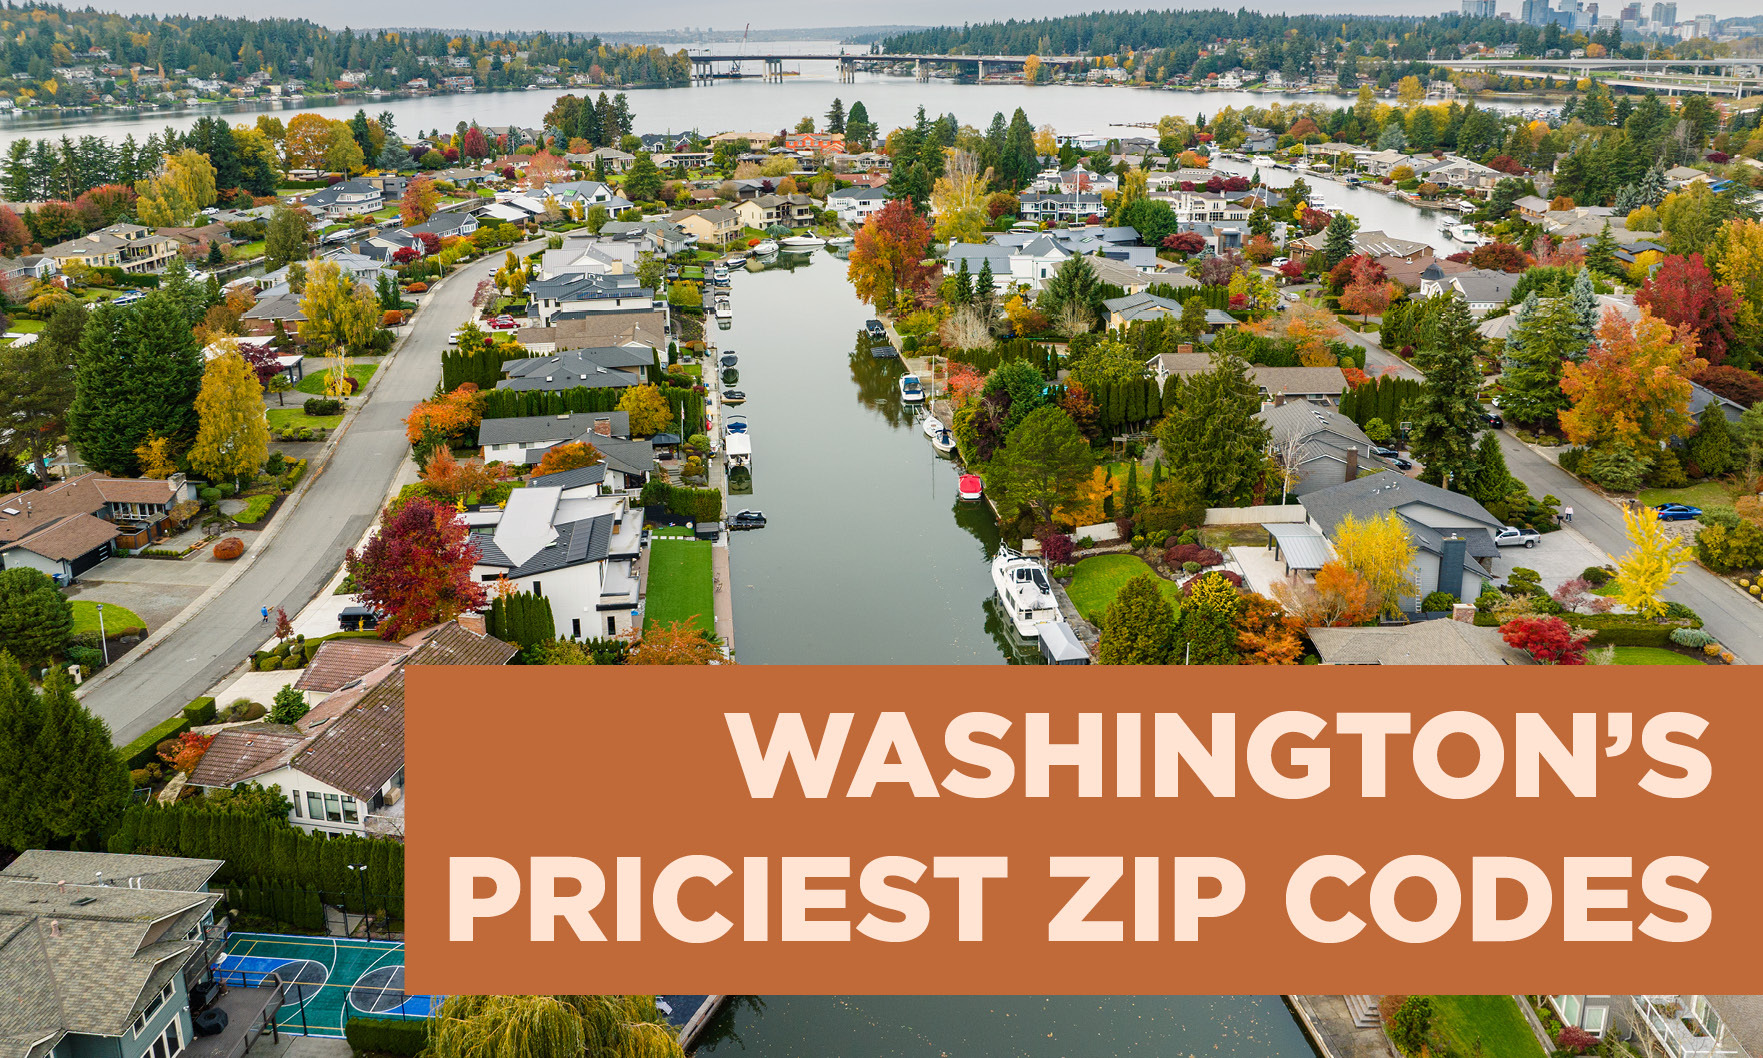
Medina’s 98039 ZIP code had a median sales price of $4.765 million, up $600,000 year over year.
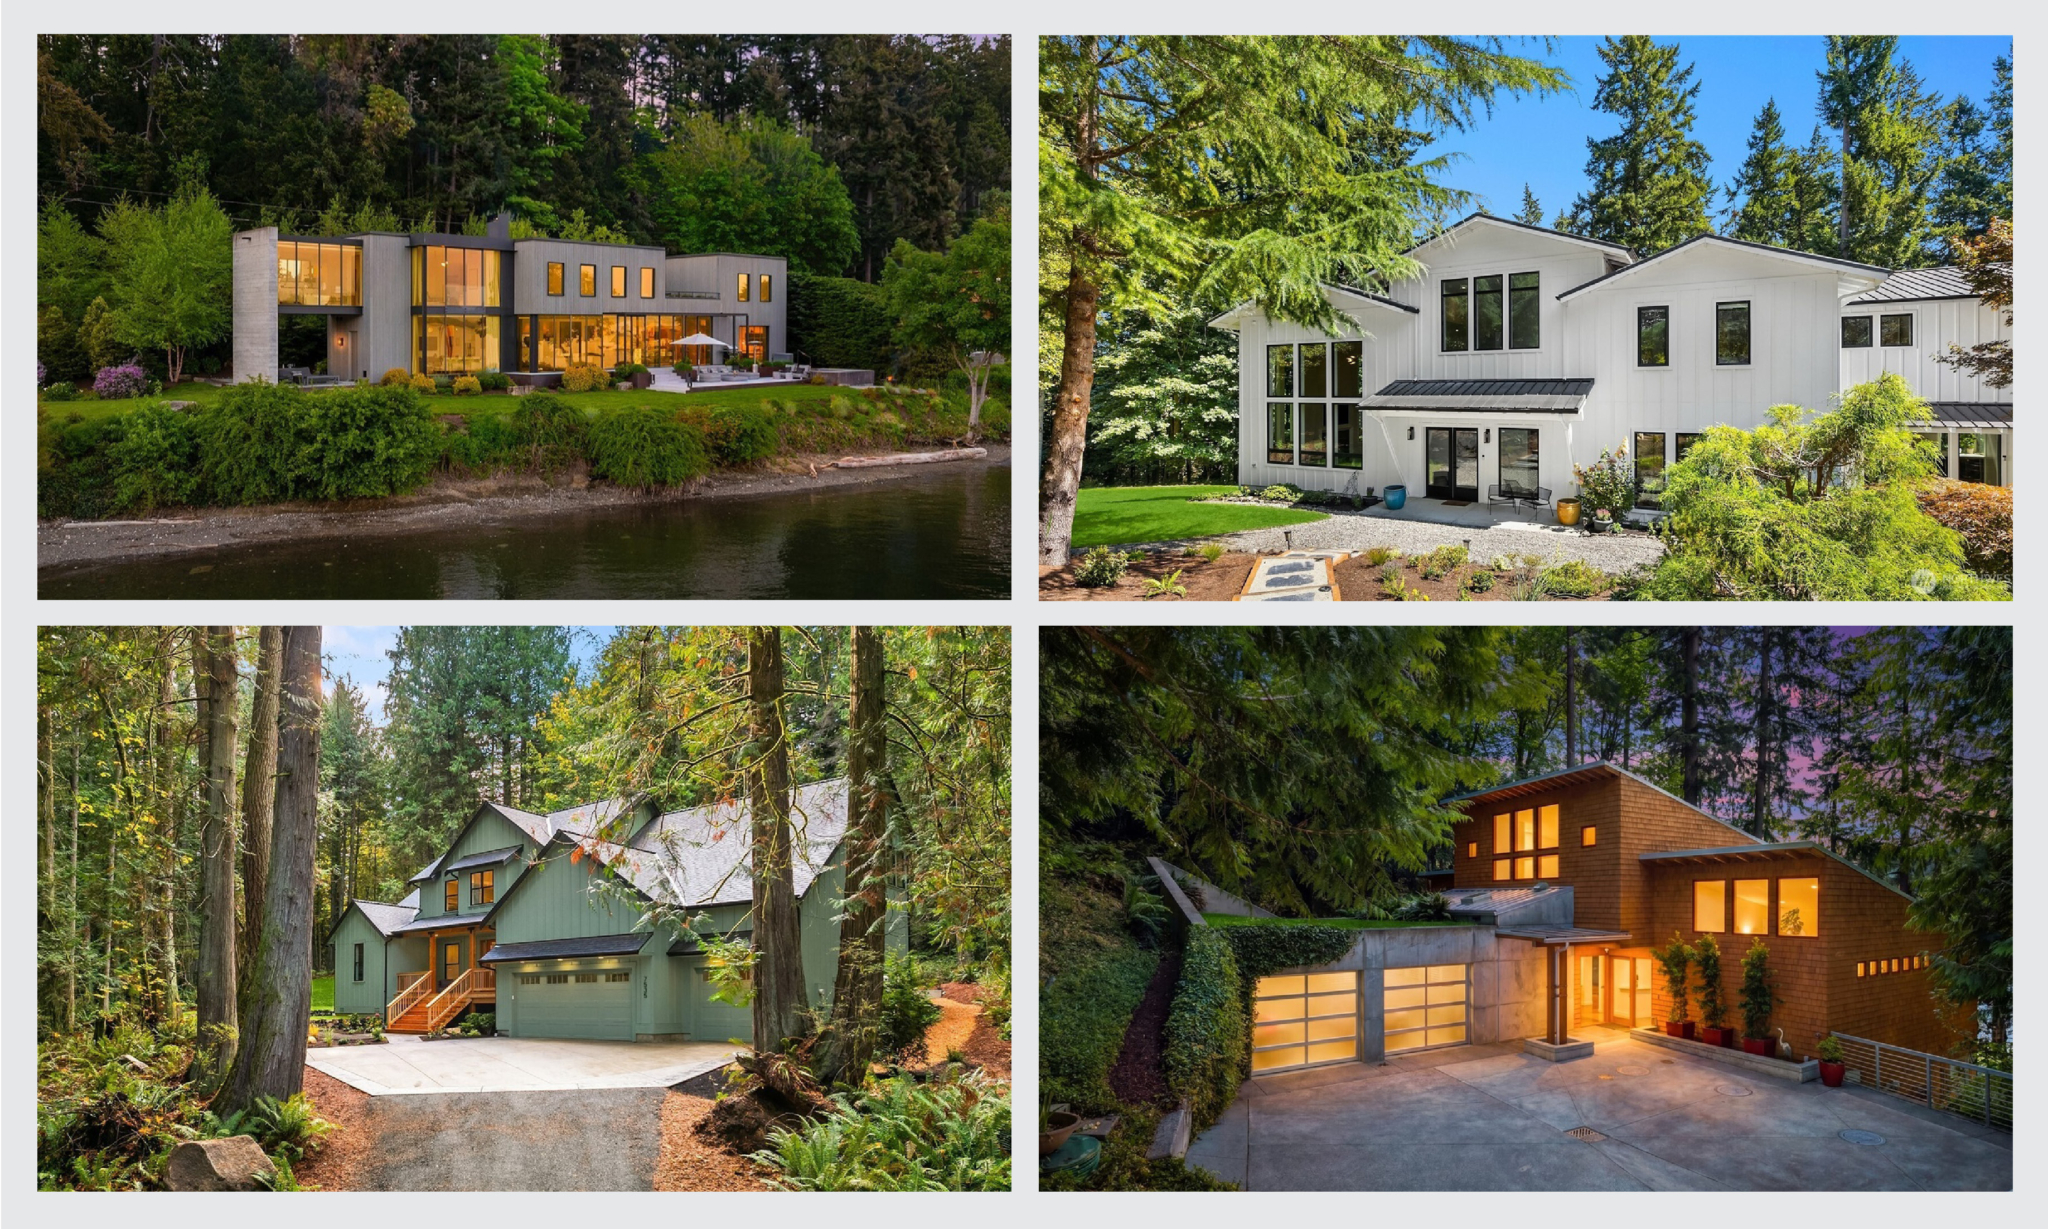
Danny Varona and Matthew Paige were responsible for five transaction sides on the September list of the 10 most expensive home sales on Bainbridge Island.
Economists were expecting a monthly decline in the annual sales rate.
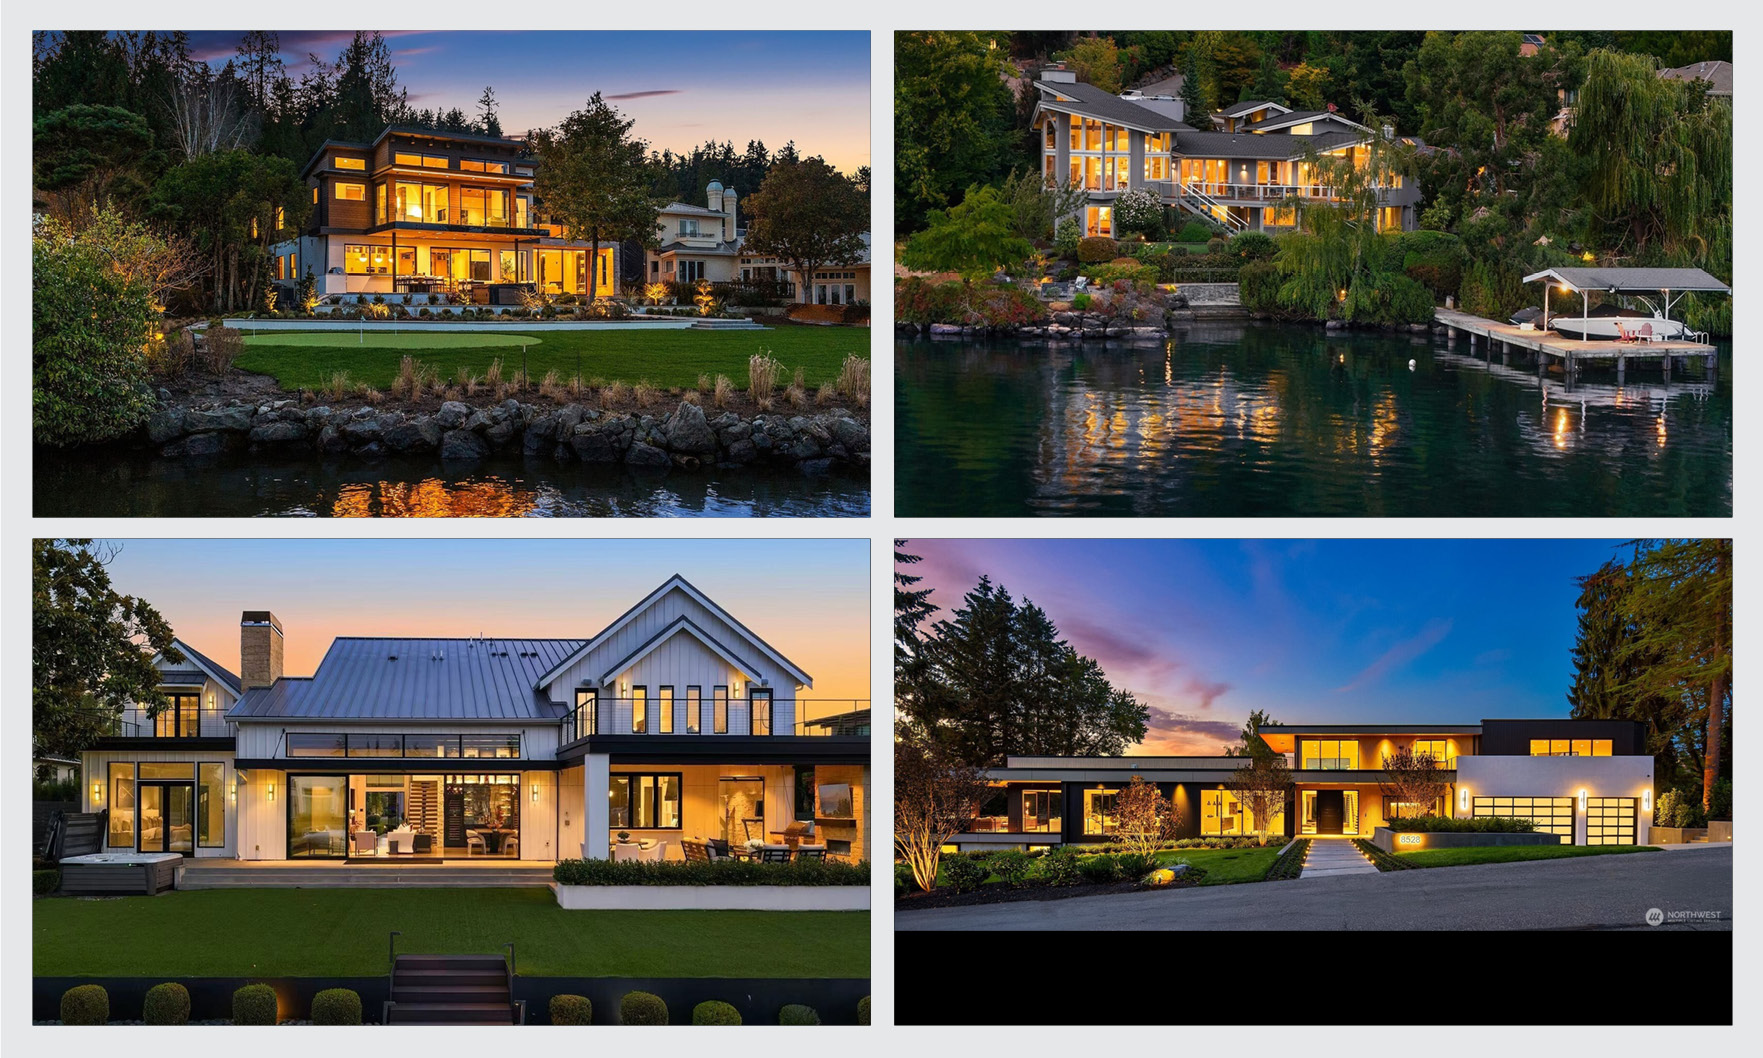
Waterfront properties on Mercer Island and Yarrow Point top the ranking of the priciest new listings in the greater Seattle area for September.
S&P Dow Jones noted that although prices rose almost 2%, in real terms, they were down, thanks to inflation, which registered 3.4% in July.
New-home inventory fell to its lowest level since December.
The month-over-month bump in contract signings was still below the pace of last August.
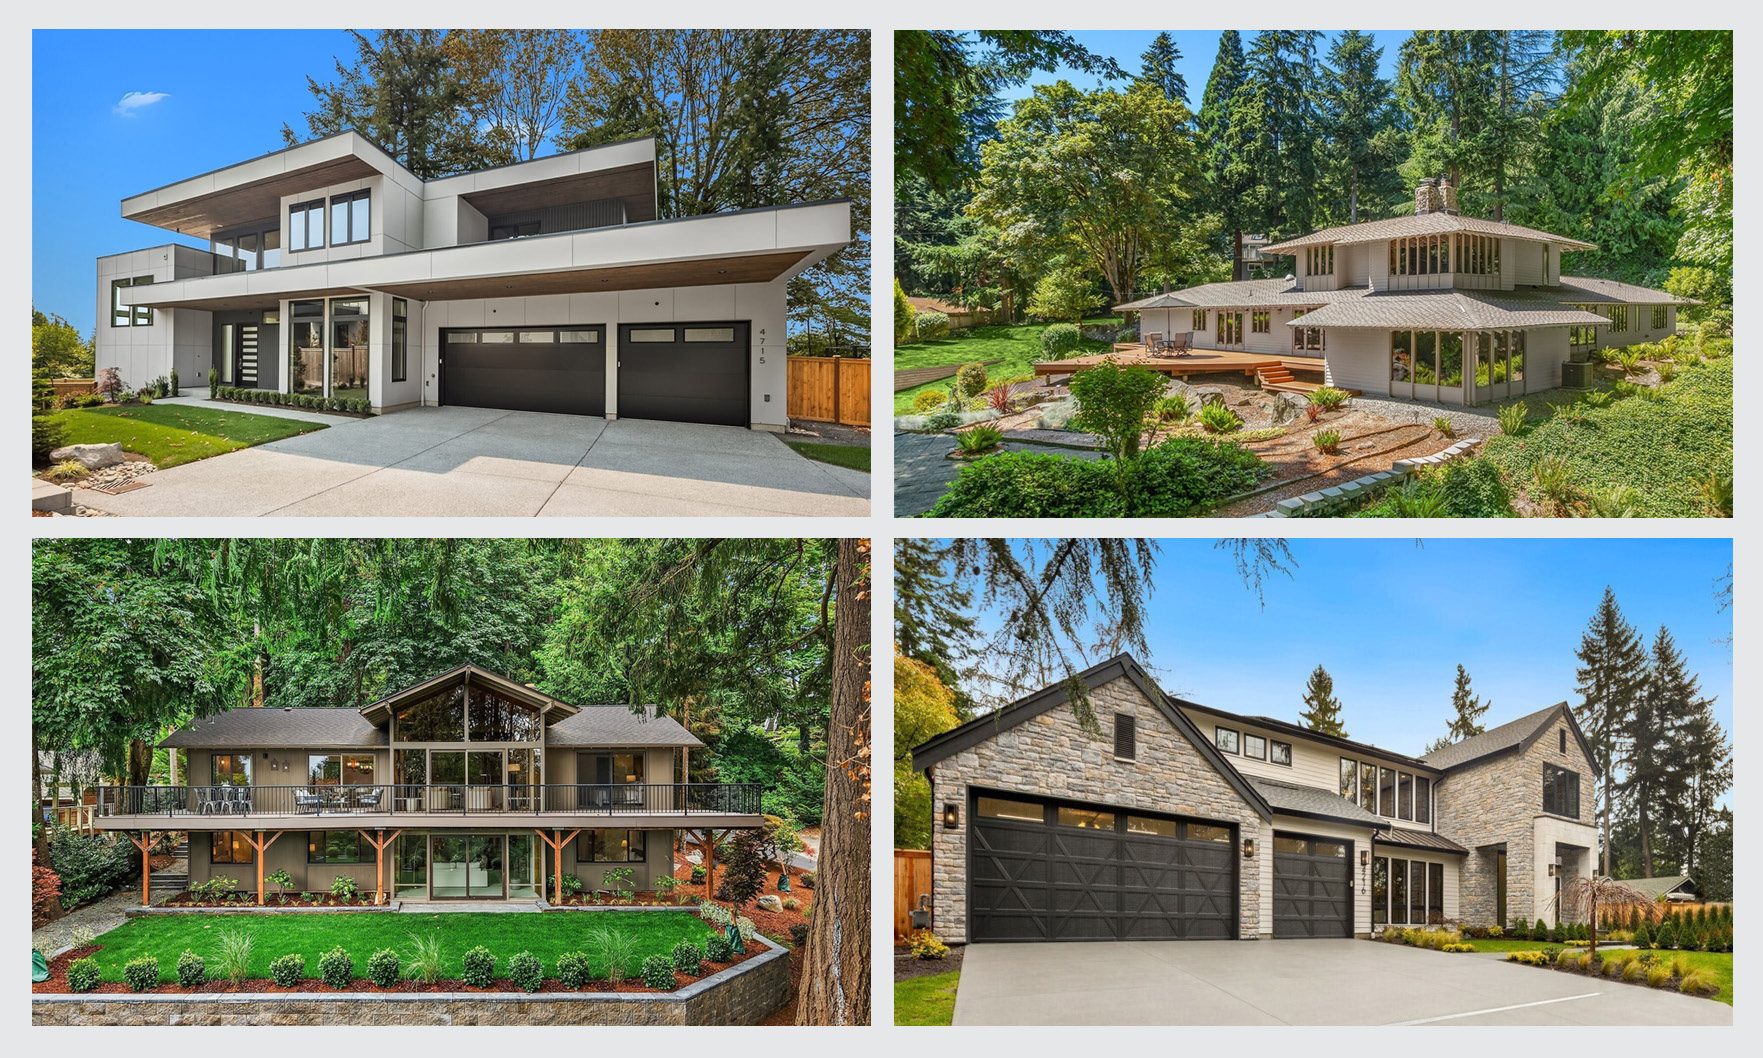
Mercer Island’s most expensive home sales last month were led by a $5.2 million property built just this year.

Since the Hispanic Wealth Project’s founding in 2014, Hispanic household wealth has more than tripled across the U.S.

In Seattle, buyers who wait until the third full week of October to buy stand to see 31.9% more active listings.
At the same time, the median-sales price rose again, as months’ supply of homes for sale hit a 10-year high.

The increase in purchase activity offset a decrease in refinancings.
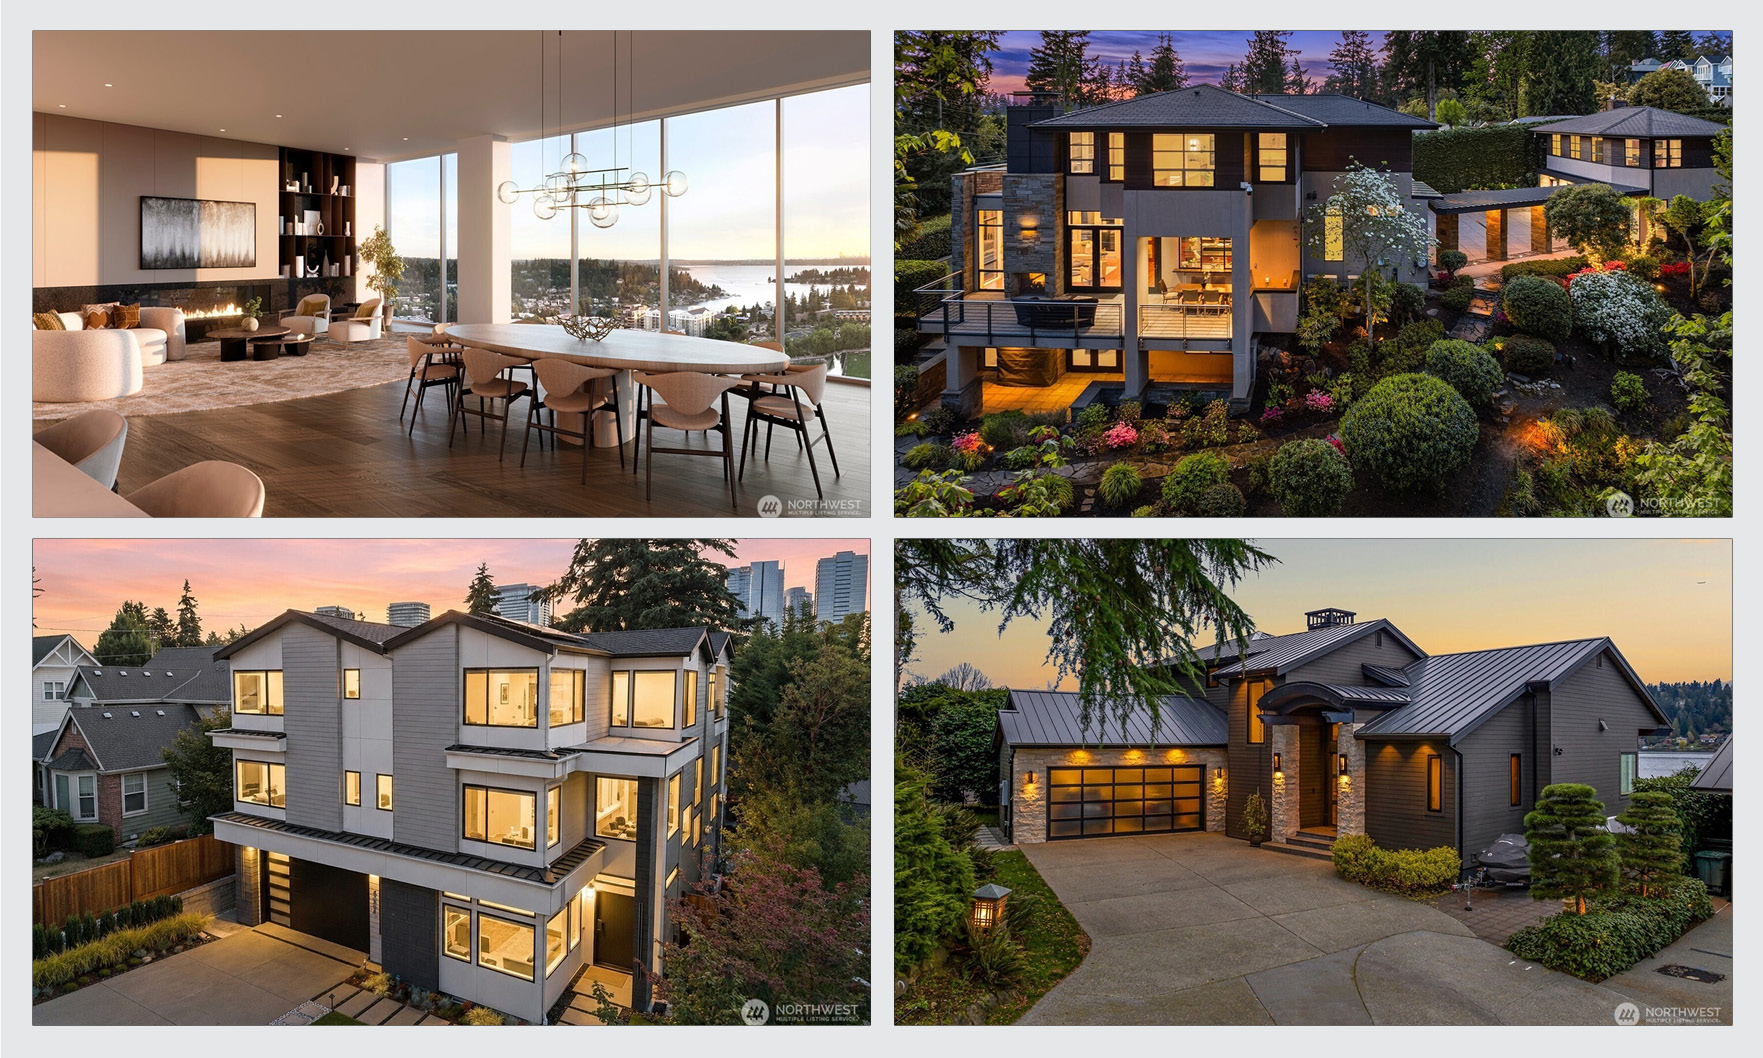
This month, we’re looking at the priciest new listings in Bellevue, led by a $10.3 million condo at the Park Row community.
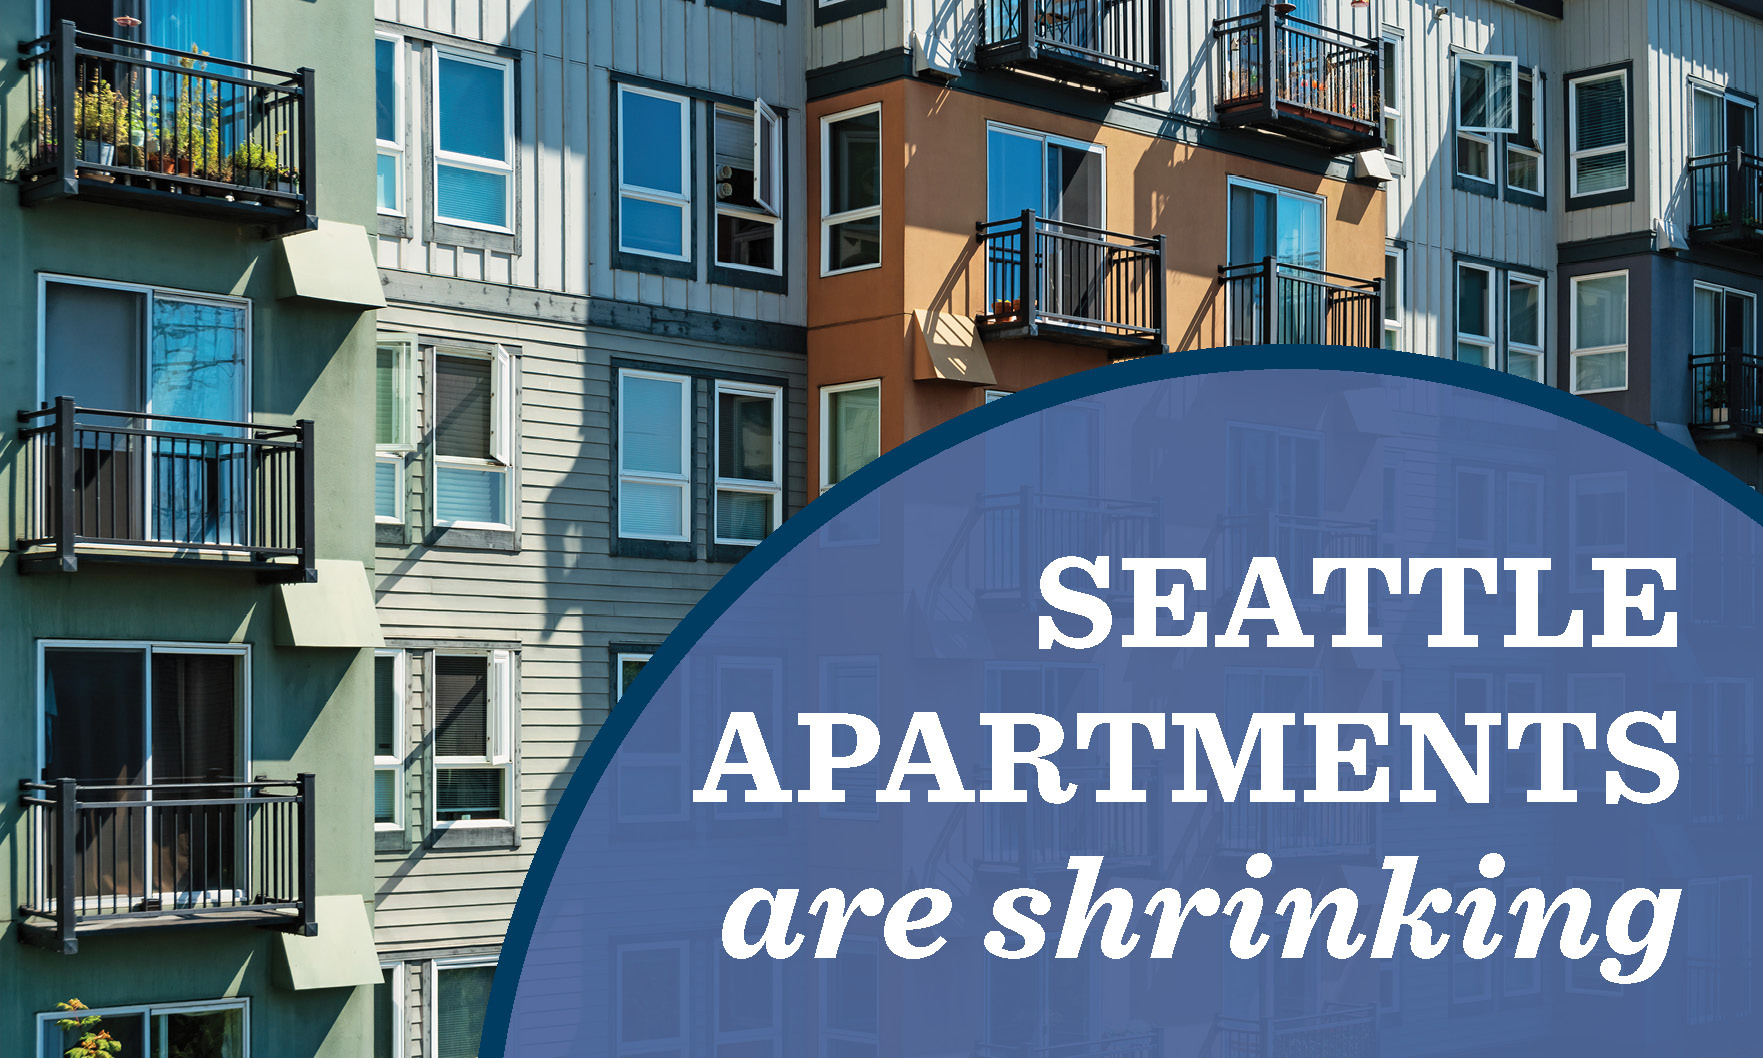
The Emerald City the place with the smallest apartments in the nation — smaller even, than San Francisco.
The pace of home-price growth rose nationally but with significant regional differences.
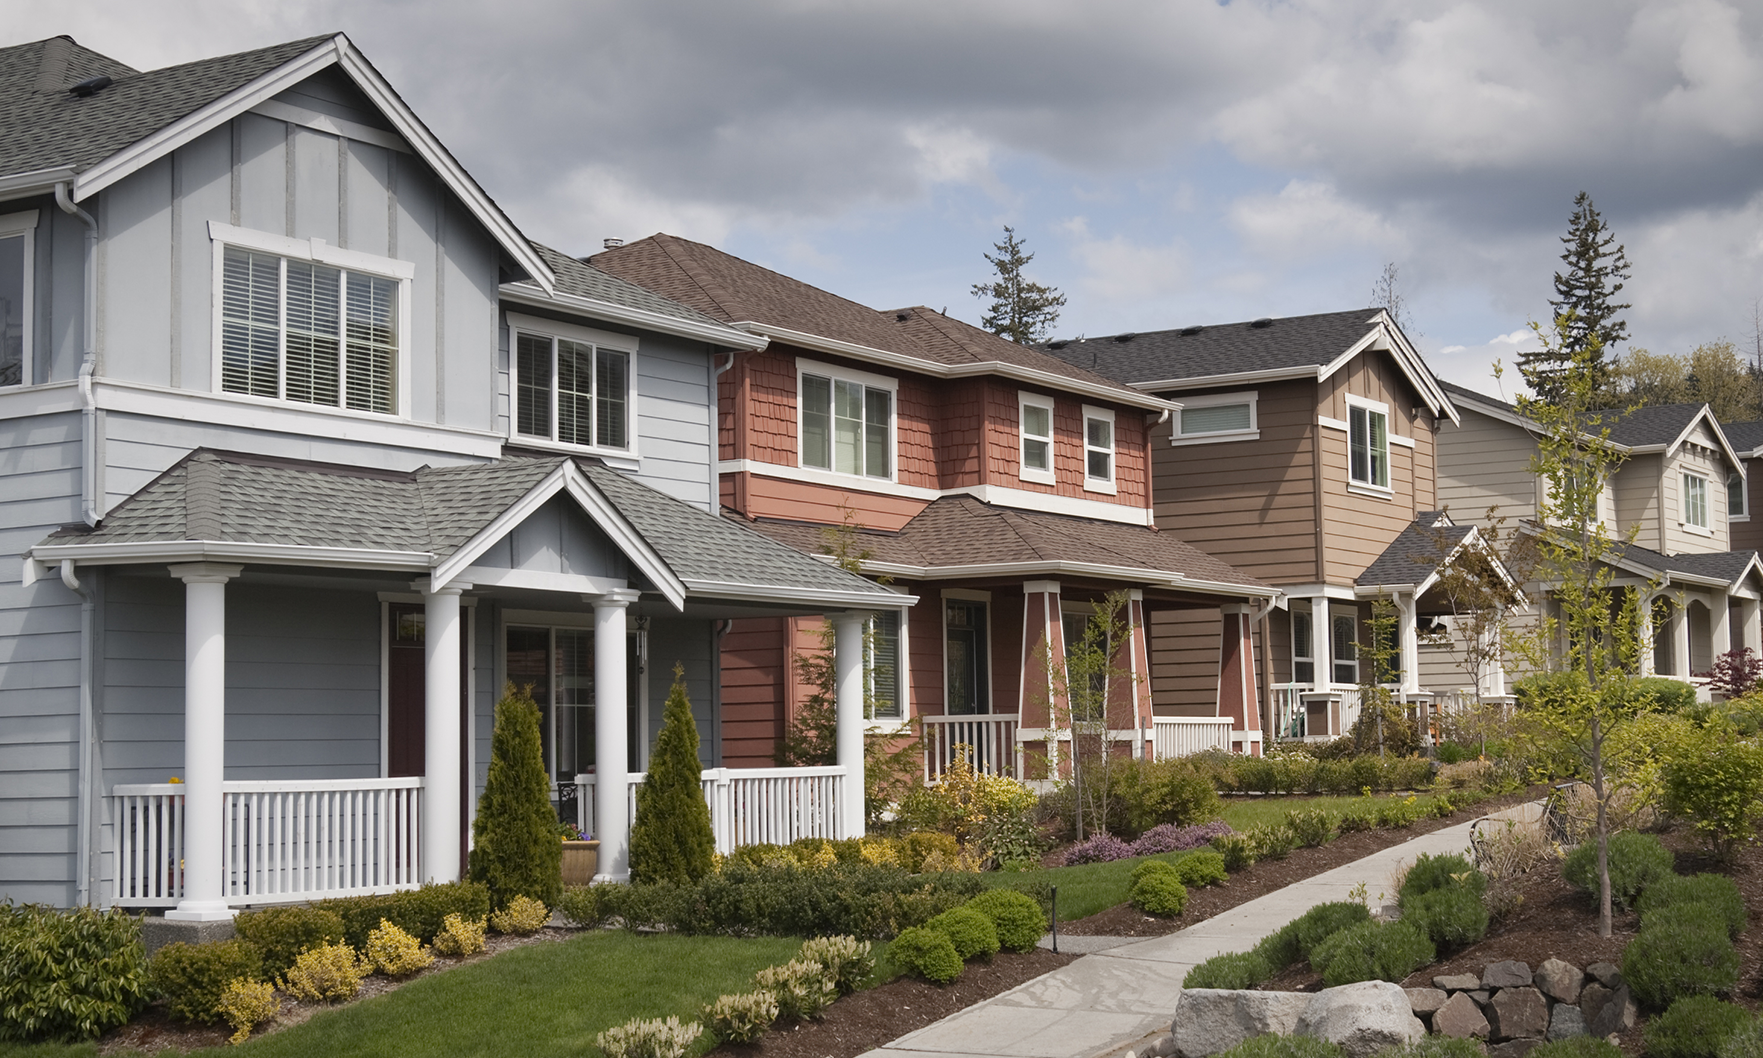
Active buyers are looking for more expensive homes, while price-constrained buyers are looking at fewer homes altogether.