
By the Numbers
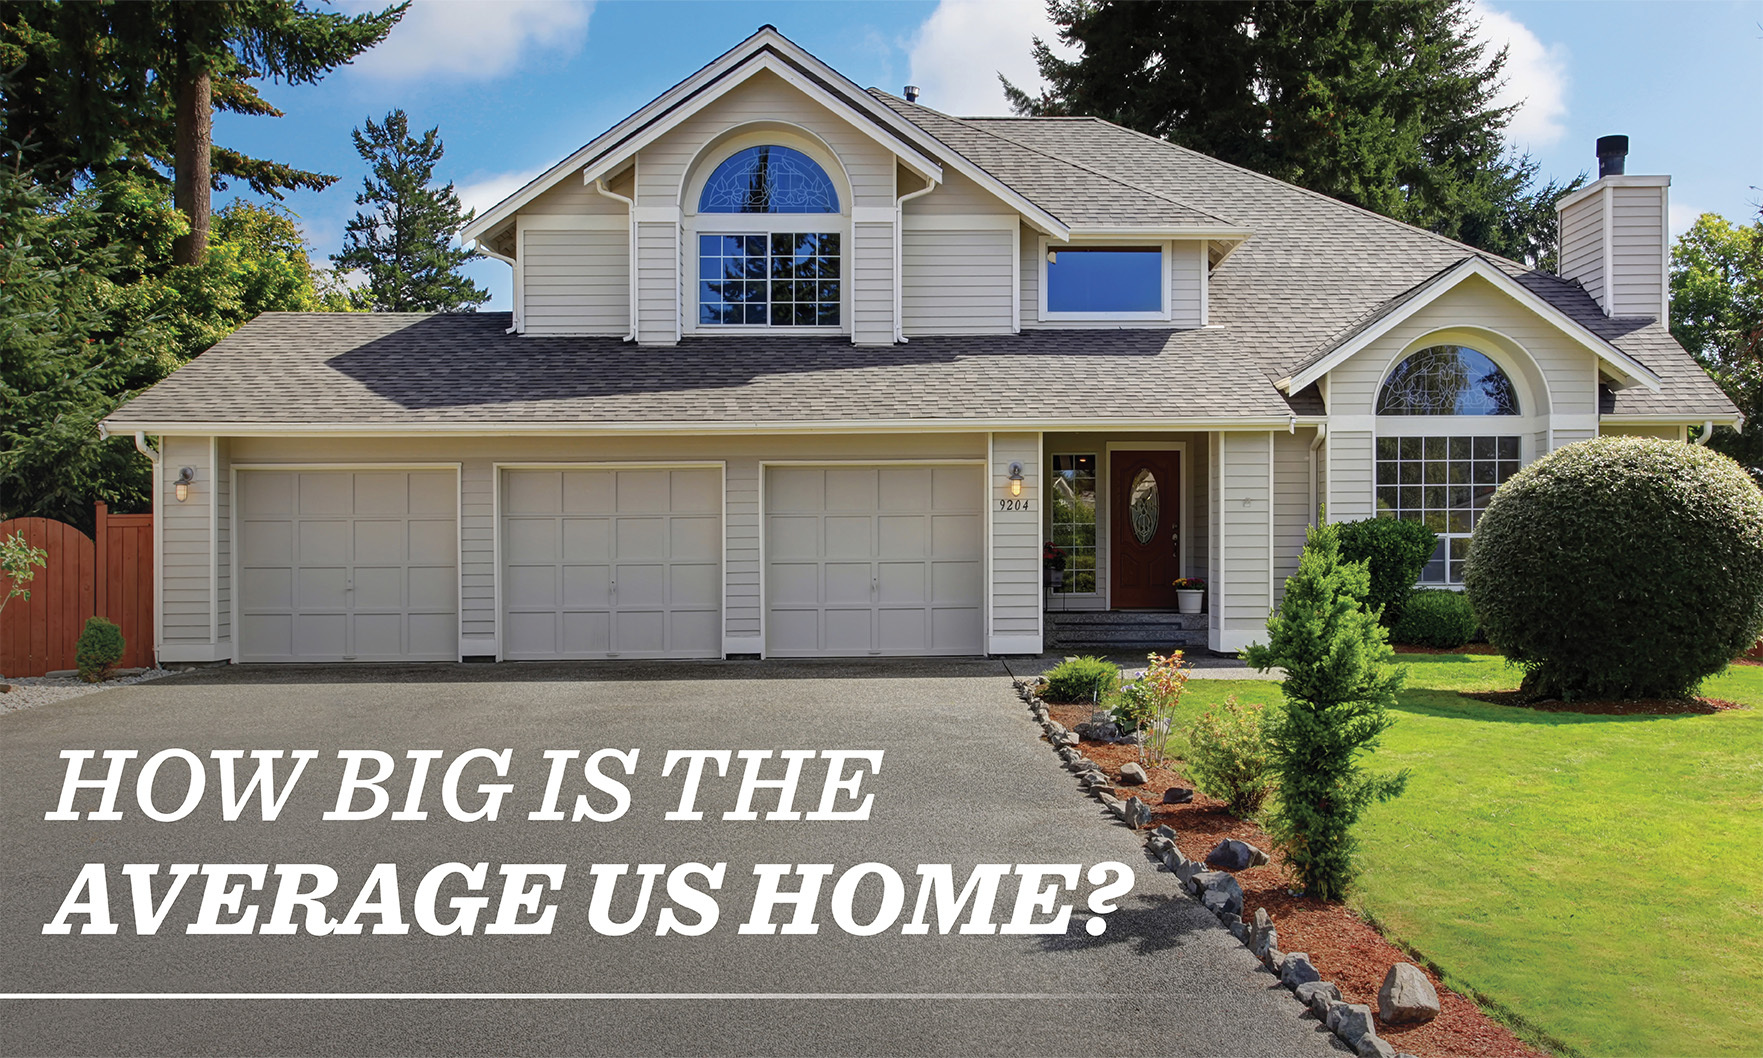
Given Washington’s average home size, buyers in the state pay an average price per square foot of $403.

The triennial survey of 2,000 American residents from the 50 largest metropolitan areas, the National Association of REALTORS® Community and Transportation Preference Survey, found buyers and residents prefer more housing options and communities designed for easy access.
Nationally, home sales in the 51 metro areas surveyed by REMAX showed measured growth of 8.9% month over month and 7.8% year over year, REMAX said.
The annual and monthly declines of 0.3% and 5.4%, respectively, do not fully capture the geographic variability of market performance.
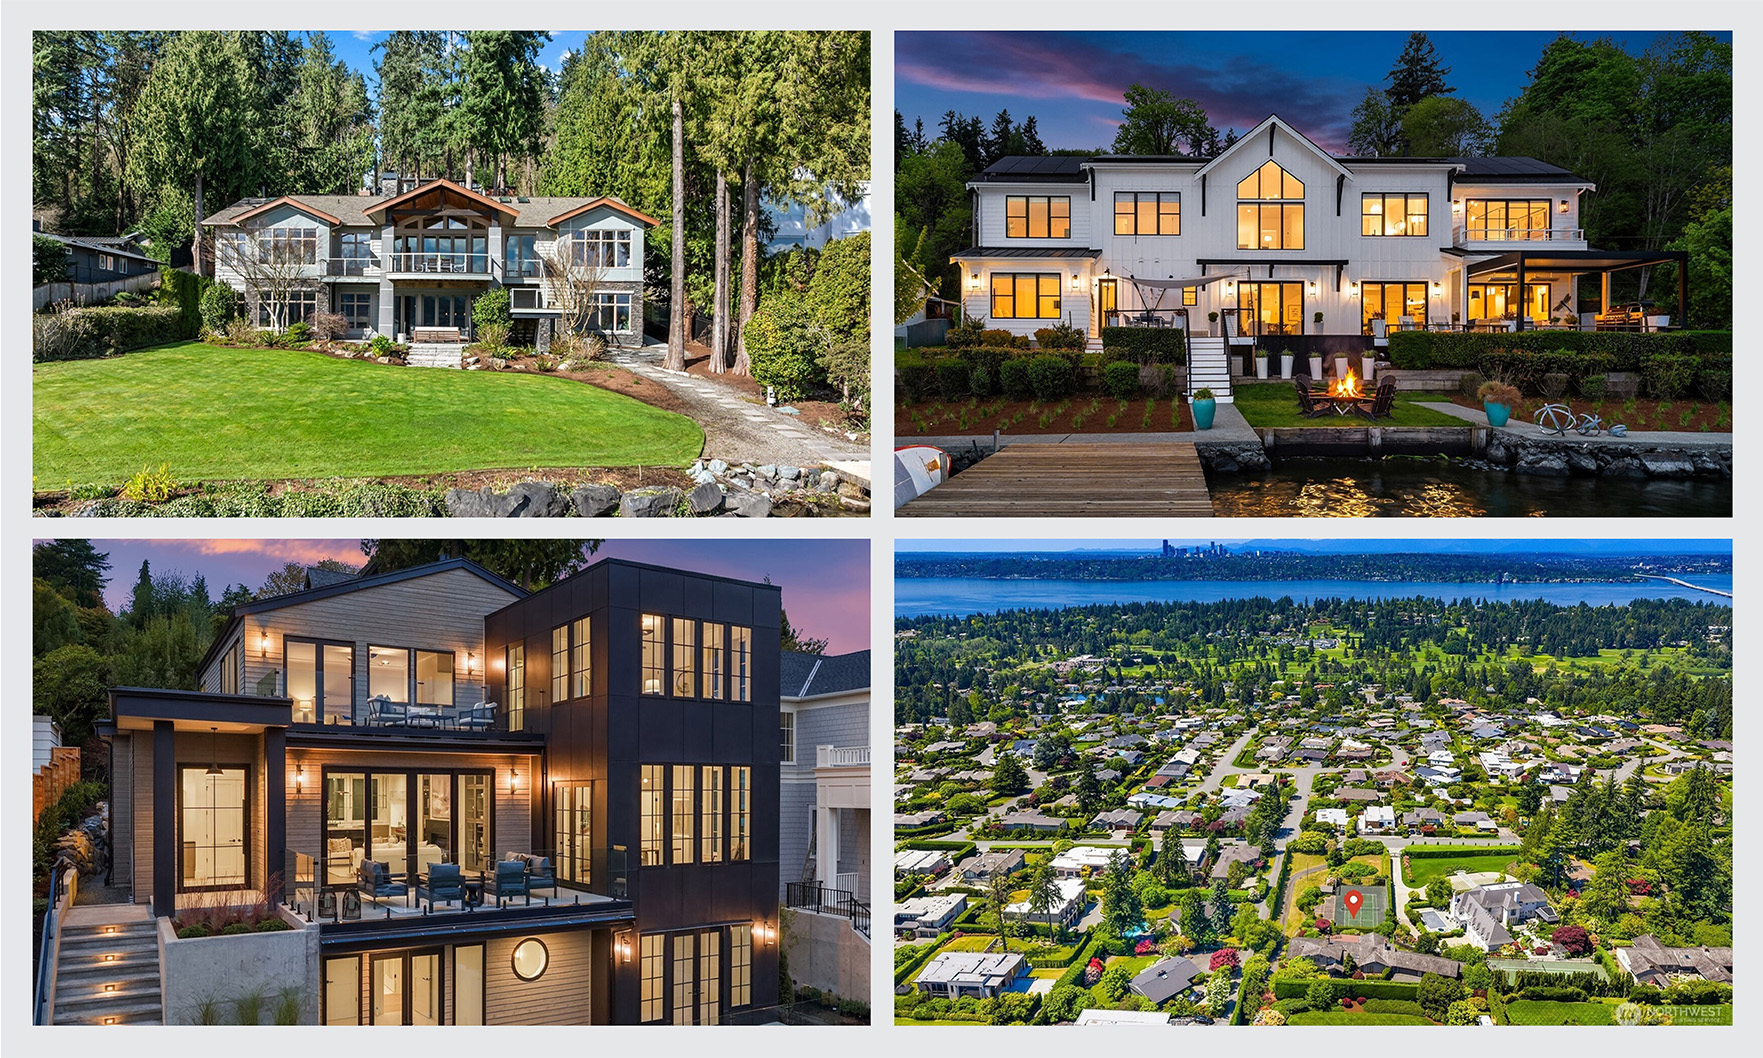
Last month, greater Seattle’s priciest home sale was a Mercer Island mansion with 101 feet of Lake Washington water frontage.

The city boasted a median income of $93,717 for graduates — higher than nearly any other large city in the country — plus 477 leisure establishments and 9 coworking spaces for every 100,000 residents.
The median sales price of a home hit an all-time high of $440,600.
Looking ahead, Cotality expects home prices to rise 4.8% between May 2026 and May 2027.
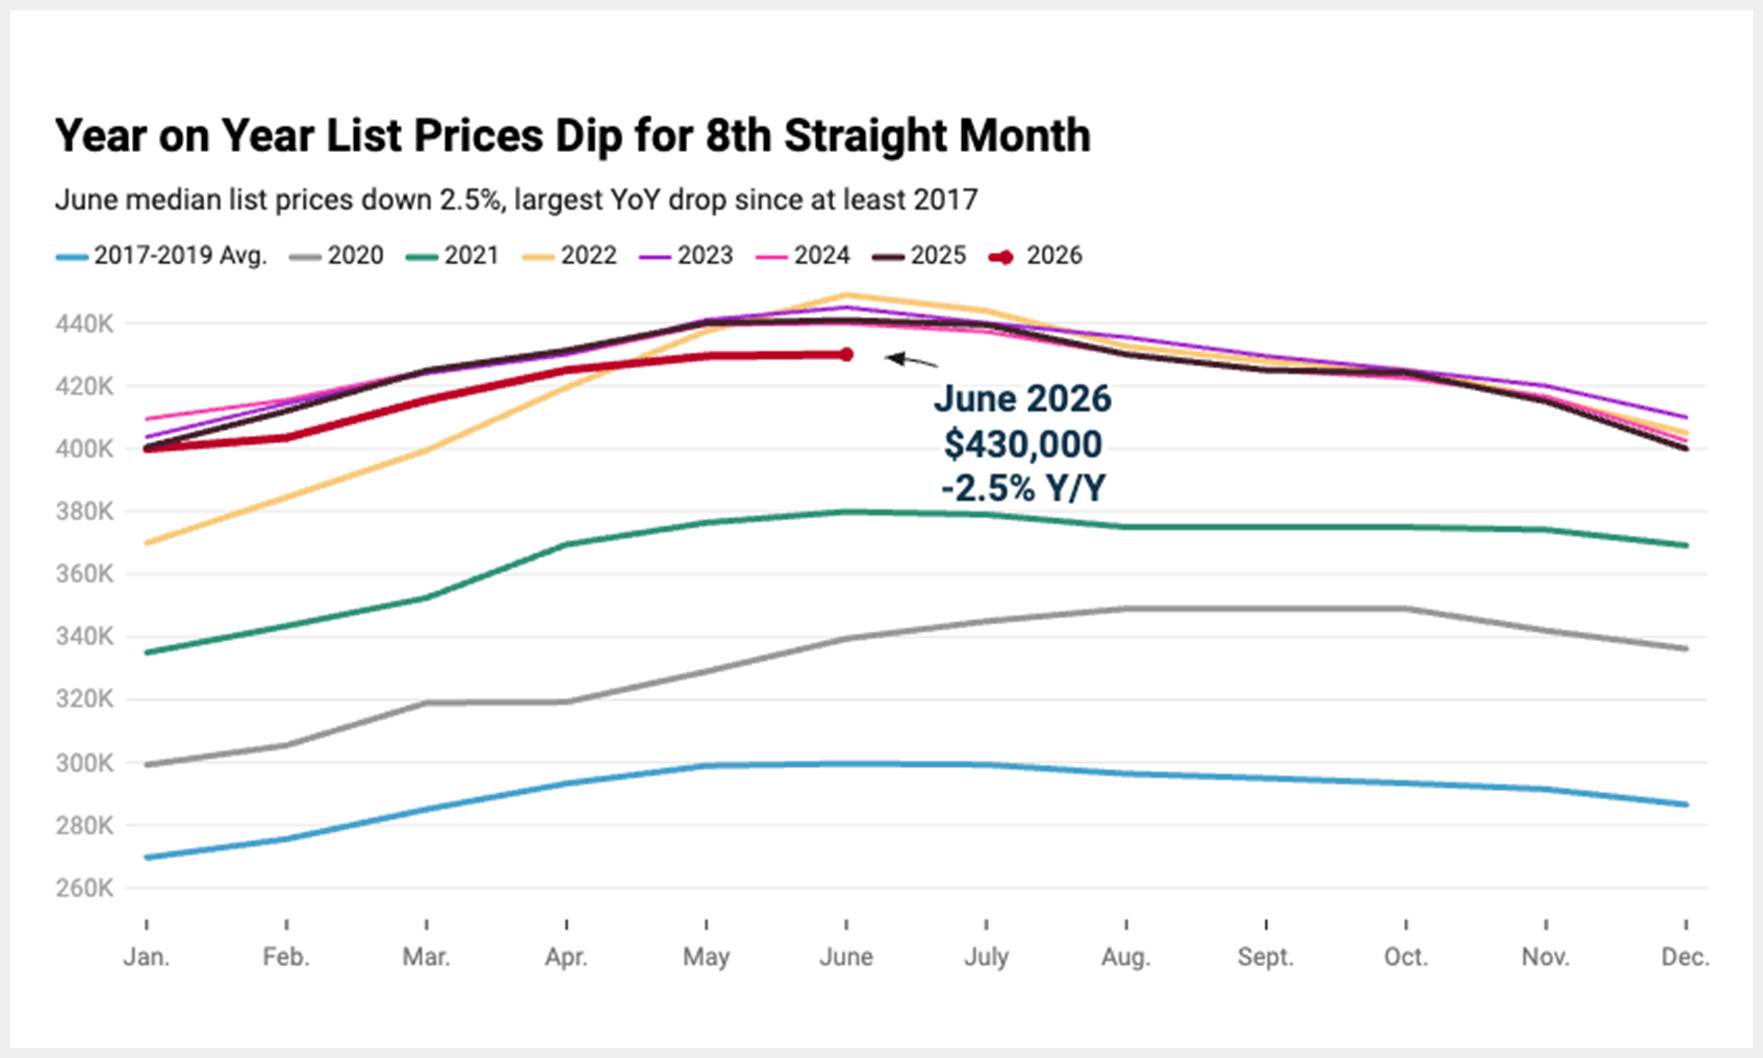
Nationally, the median list price slipped 2.4%, marking the eighth month in a row of declines.

The uptick was driven by a slight dip in mortgage rates.
S&P Dow Jones Indices noted that inflation outpaced national home-price appreciation for the 11th month in a row.
Home sales in the 51 metro areas surveyed by REMAX rose 7.9% month over month and slid 0.5% year over year.
The increase was driven by refinancing activity as purchase applications dipped.
With everything from housing to gas to event tickets costing more, it may be impossible for fans to put a price tag on the joy of attending a once-in-a-lifetime World Cup match hosted in their hometown.
The 3.8% month-over-month gain was almost four times what industry observers were expecting.
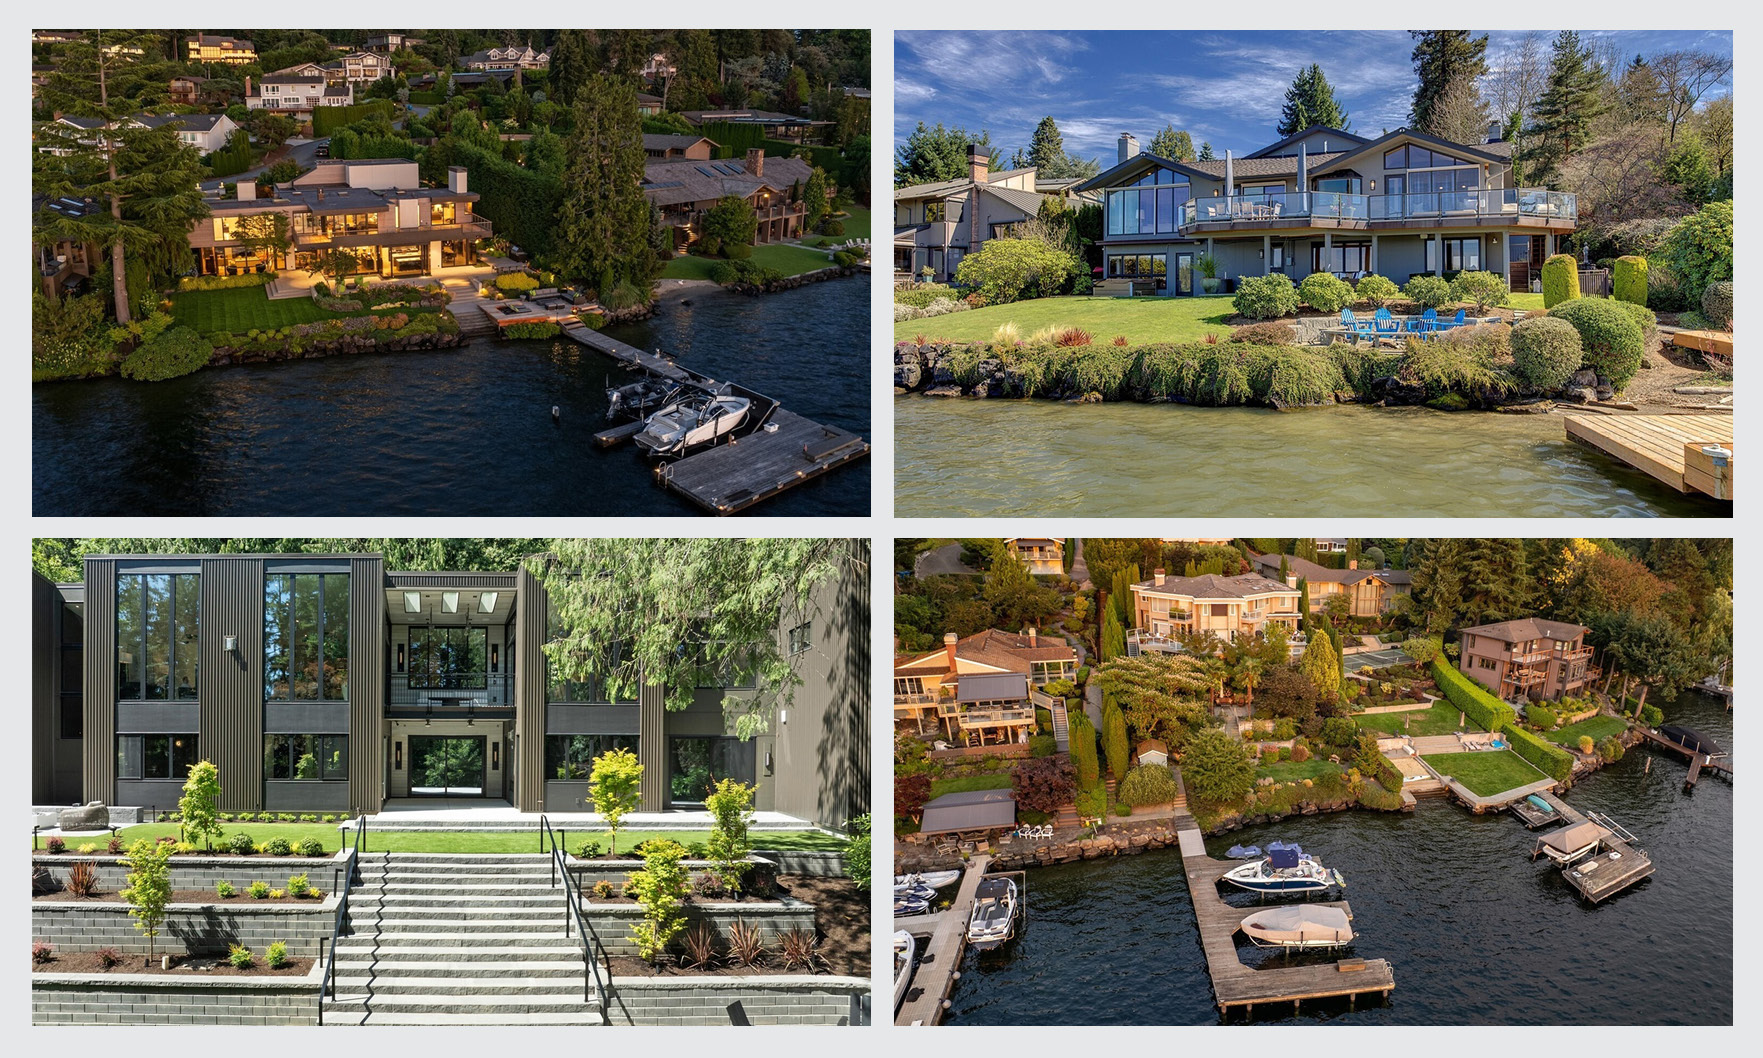
May’s priciest Seattle-area home sale was a lakefront midcentury mansion on Mercer Island.