
Trends
For data-driven stories, to appear under “Trends” menu
A third consecutive month of increases in the S&P CoreLogic Case-Shiller U.S. National Home Price Index lends new evidence to claims that previous declines could be behind the market.

Demand for newly built homes has remained strong as high interest rates keep many would-be sellers of existing homes off the market.

At the same time, the median existing-home price for all housing types slid 3.1% year over year to $396,100.
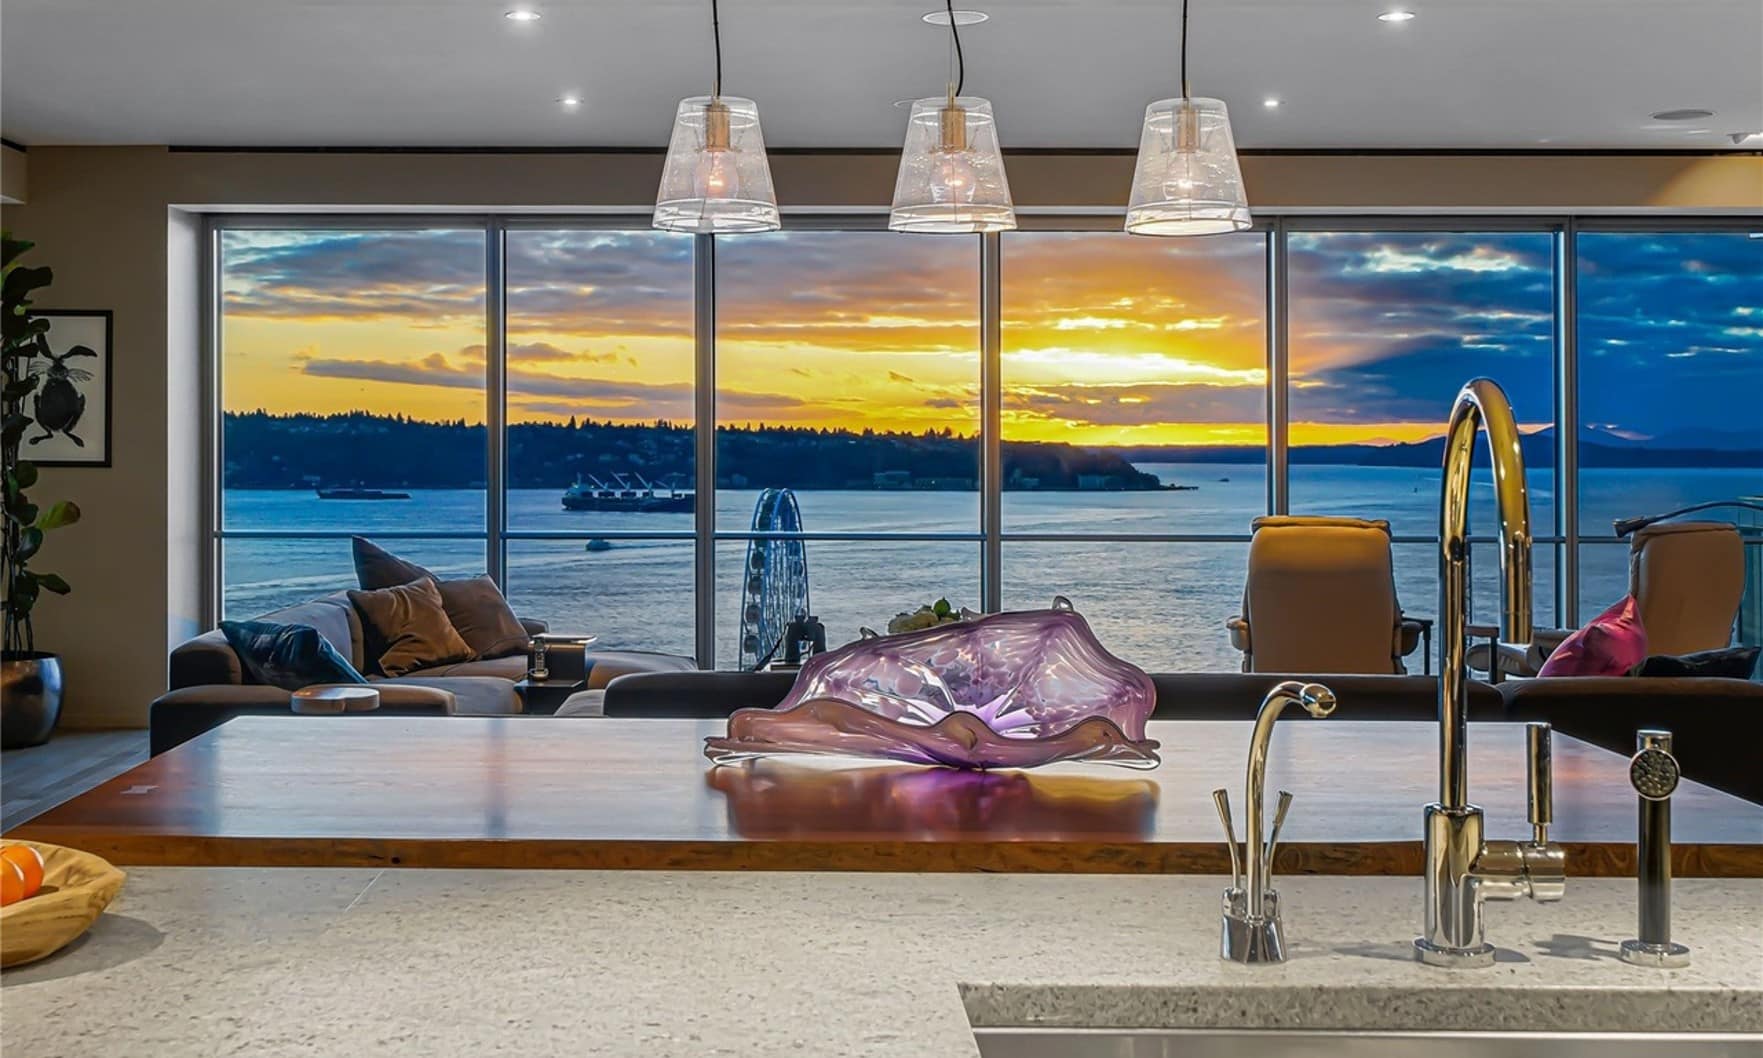
Three of the most expensive new listings this month are luxury penthouses — two of which are located at The Four Seasons Private Residences.

Motivations for homeownership are varied across generations: Gen Z and Boomers made the decision for better living conditions, while Gen X and Millennials were in search of stability they couldn’t get while renting.

“Paint is a relatively affordable and easy change, yet it has an outsized impact on a buyer’s perception of the home,” said Amanda Pendleton, home trends expert at Zillow.

The larger-than-expected increase comes as homebuilder sentiment rose for the sixth month in a row.

Seattle has grown tremendously in the past few years as a hub for tech and business, but with layoffs and work-from-home trends, it’s the Seattle suburbs that may now be the best place to start working in software engineering.

The area also saw some of the biggest year-over-year decreases in new listings and median sales price.
A second consecutive month of increases in the S&P CoreLogic Case-Shiller U.S. National Home Price Index could indicate a reversal of the negative trend that began last year.
Despite solid demand, a dearth of homes for sale kept transaction numbers muted in the association’s most recent report on pending sales.
A shortage of existing inventory continues to drive buyers to new construction.
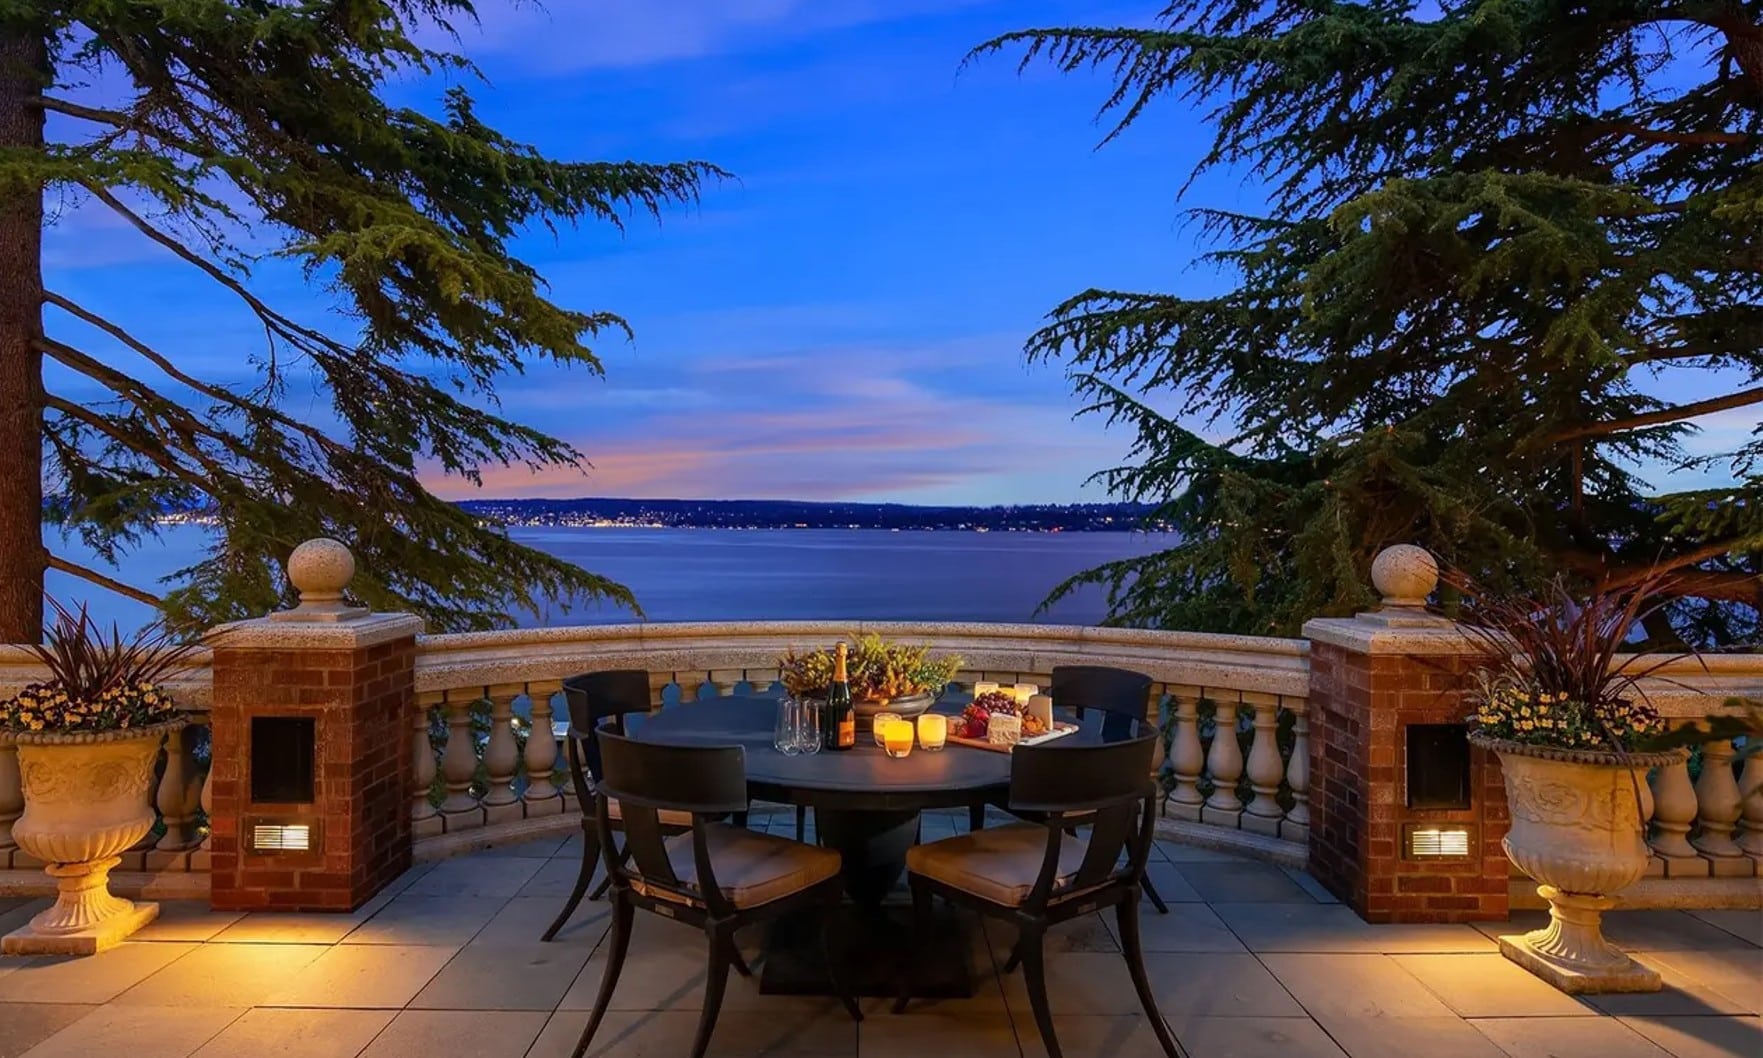
Stunning ocean views are a prominent theme in this past month’s collection of the most expensive luxury listings.
Multiple-offer situations have returned with the spring buying season while distressed and forced sales are “virtually nonexistent,” the National Association of REALTORS® said.
Single-family permits also posted a gain, indicating even more new homes are headed to today’s supply-constrained housing market.

Homebuilder optimism was buoyed by continued shortages of new housing inventory, the National Association of Home Builders reported.