Current Market Data
There are nearly 40% fewer homes for sale now than before the pandemic began

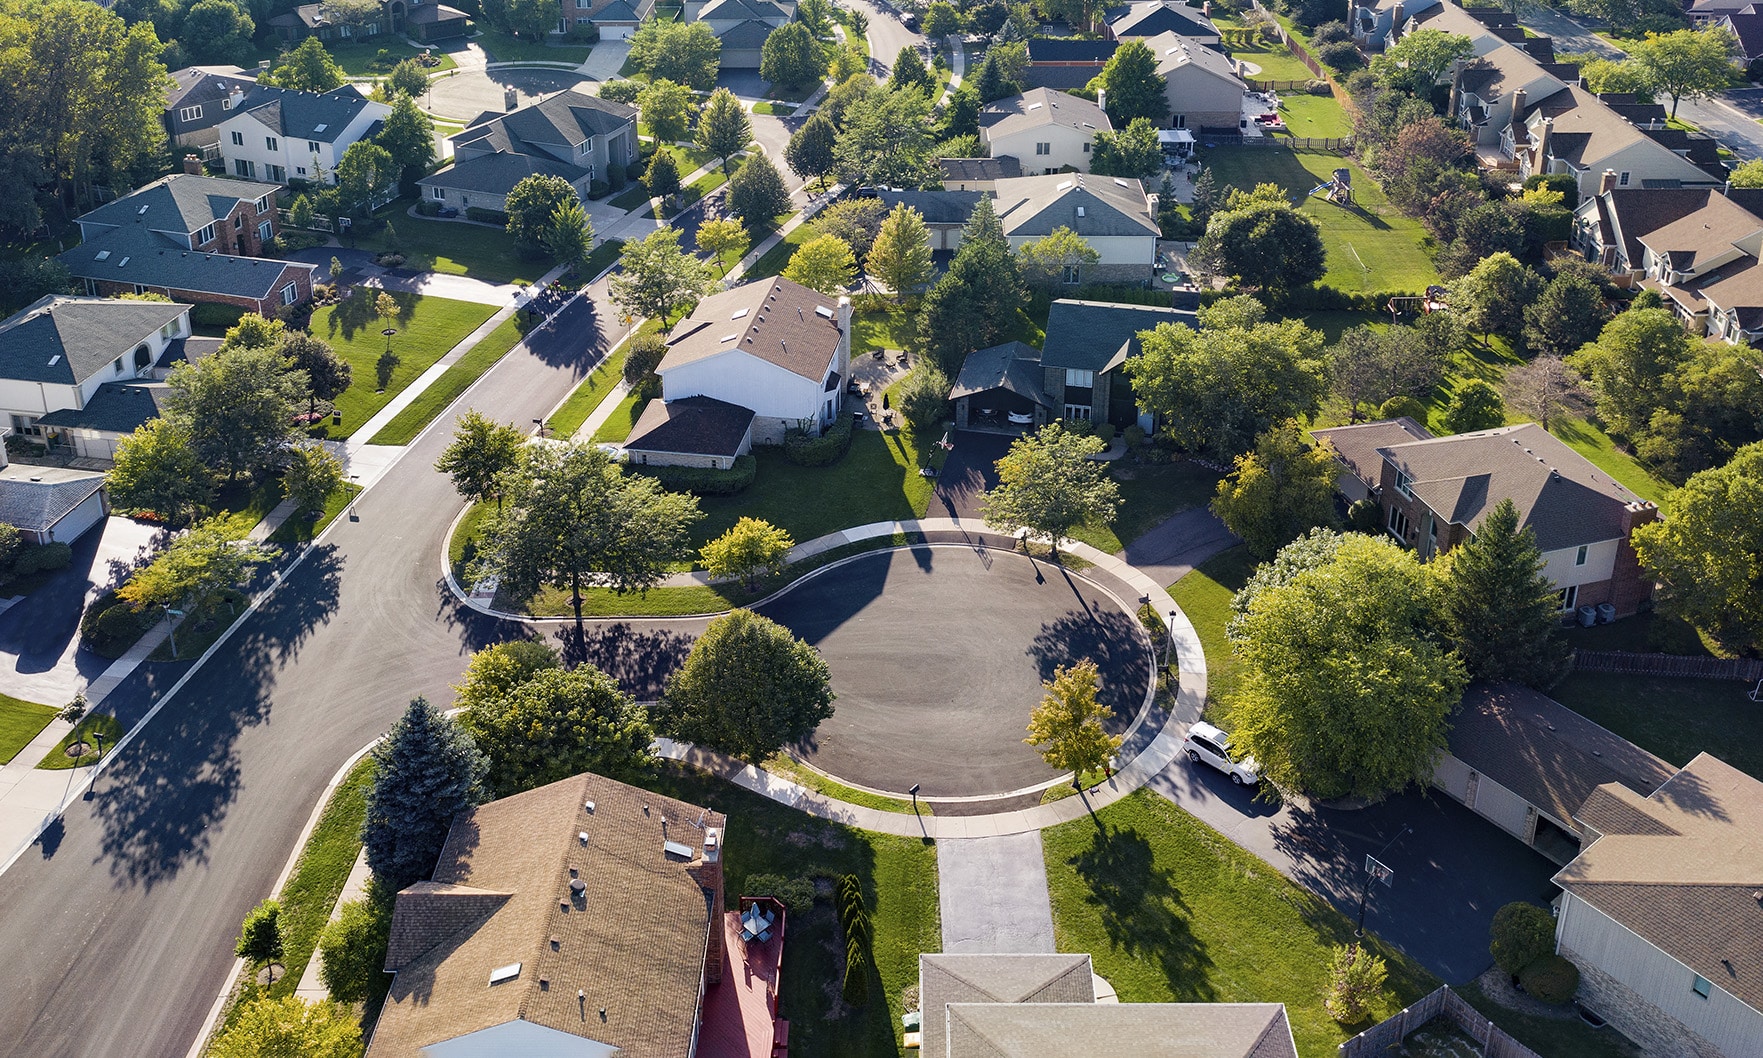
Seattle has grown tremendously in the past few years as a hub for tech and business, but with layoffs and work-from-home trends, it’s the Seattle suburbs that may now be the best place to start working in software engineering.
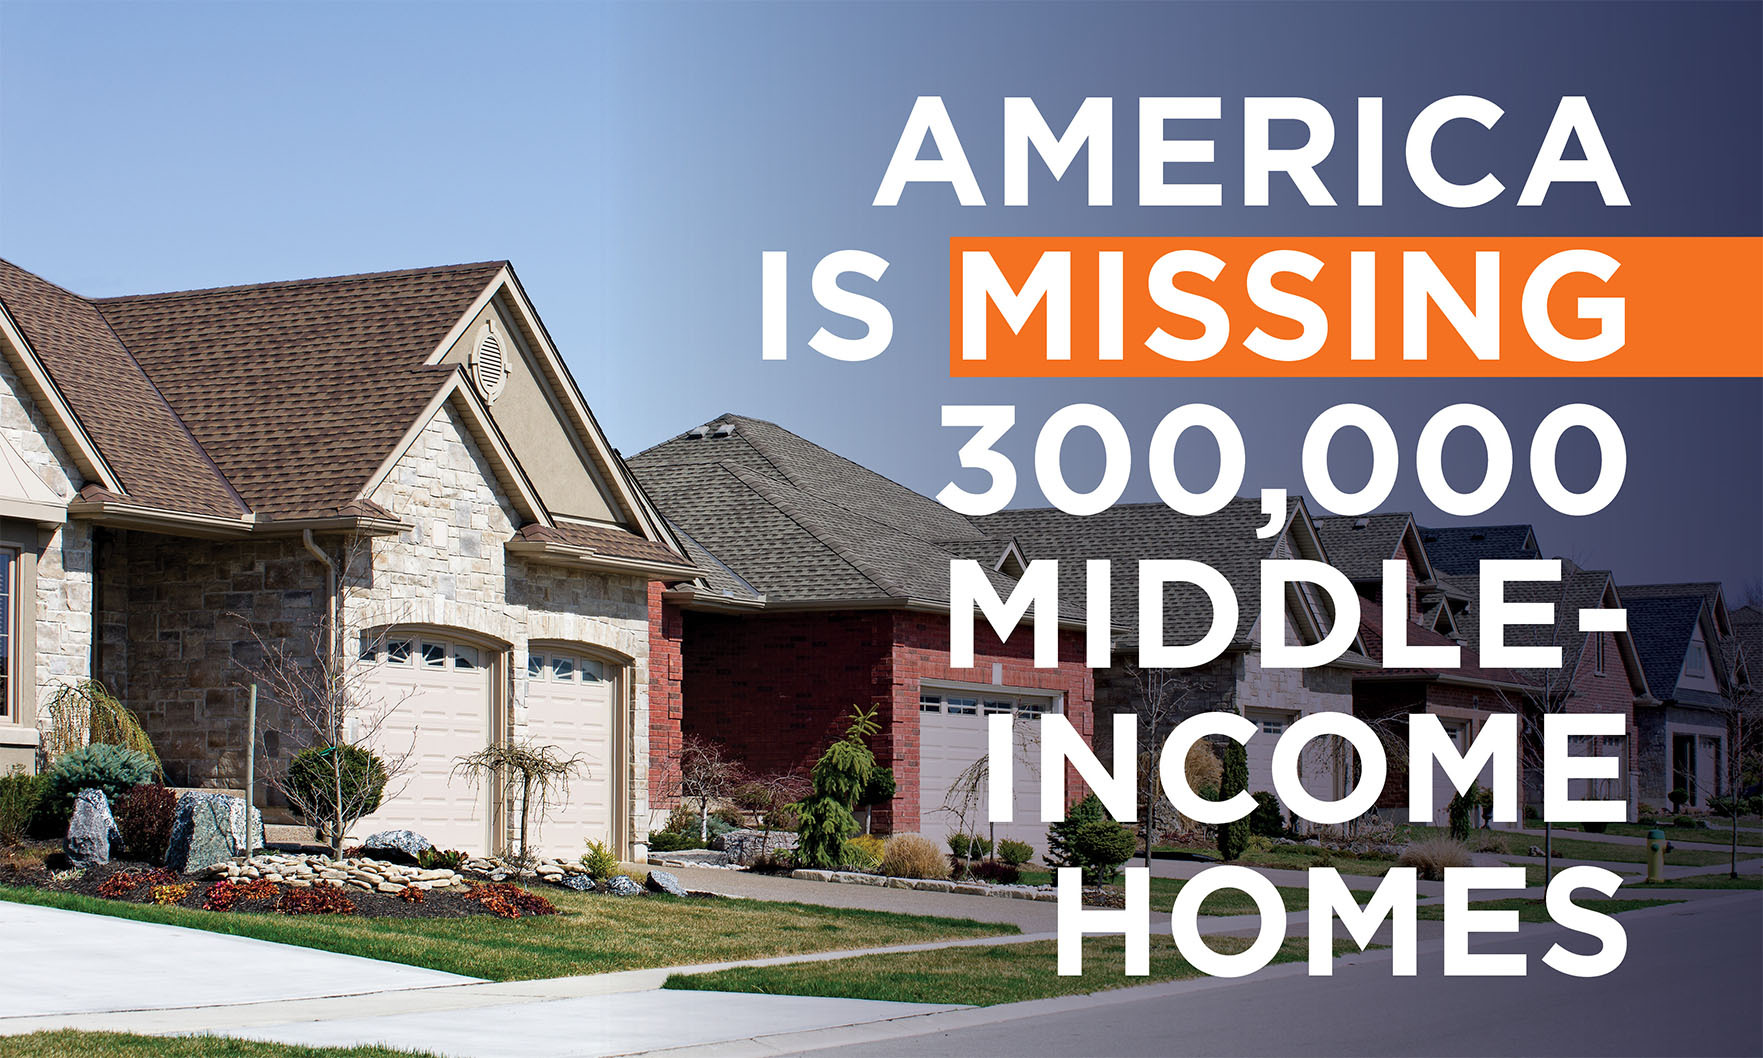
Homes affordable to middle-income buyers — defined as households earning up to $75,000 — fall in the $256,000-to-$320,000 range. But of the over one million U.S. homes on the market at the end of April, less than a quarter of all listings were within that price range.
Homebuyers in Washington last month saw the largest inventory selection since December 2022, according to the Northwest Multiple Listing Service Monthly Market Update.
Seattle’s listings were down 10.8% from last year.
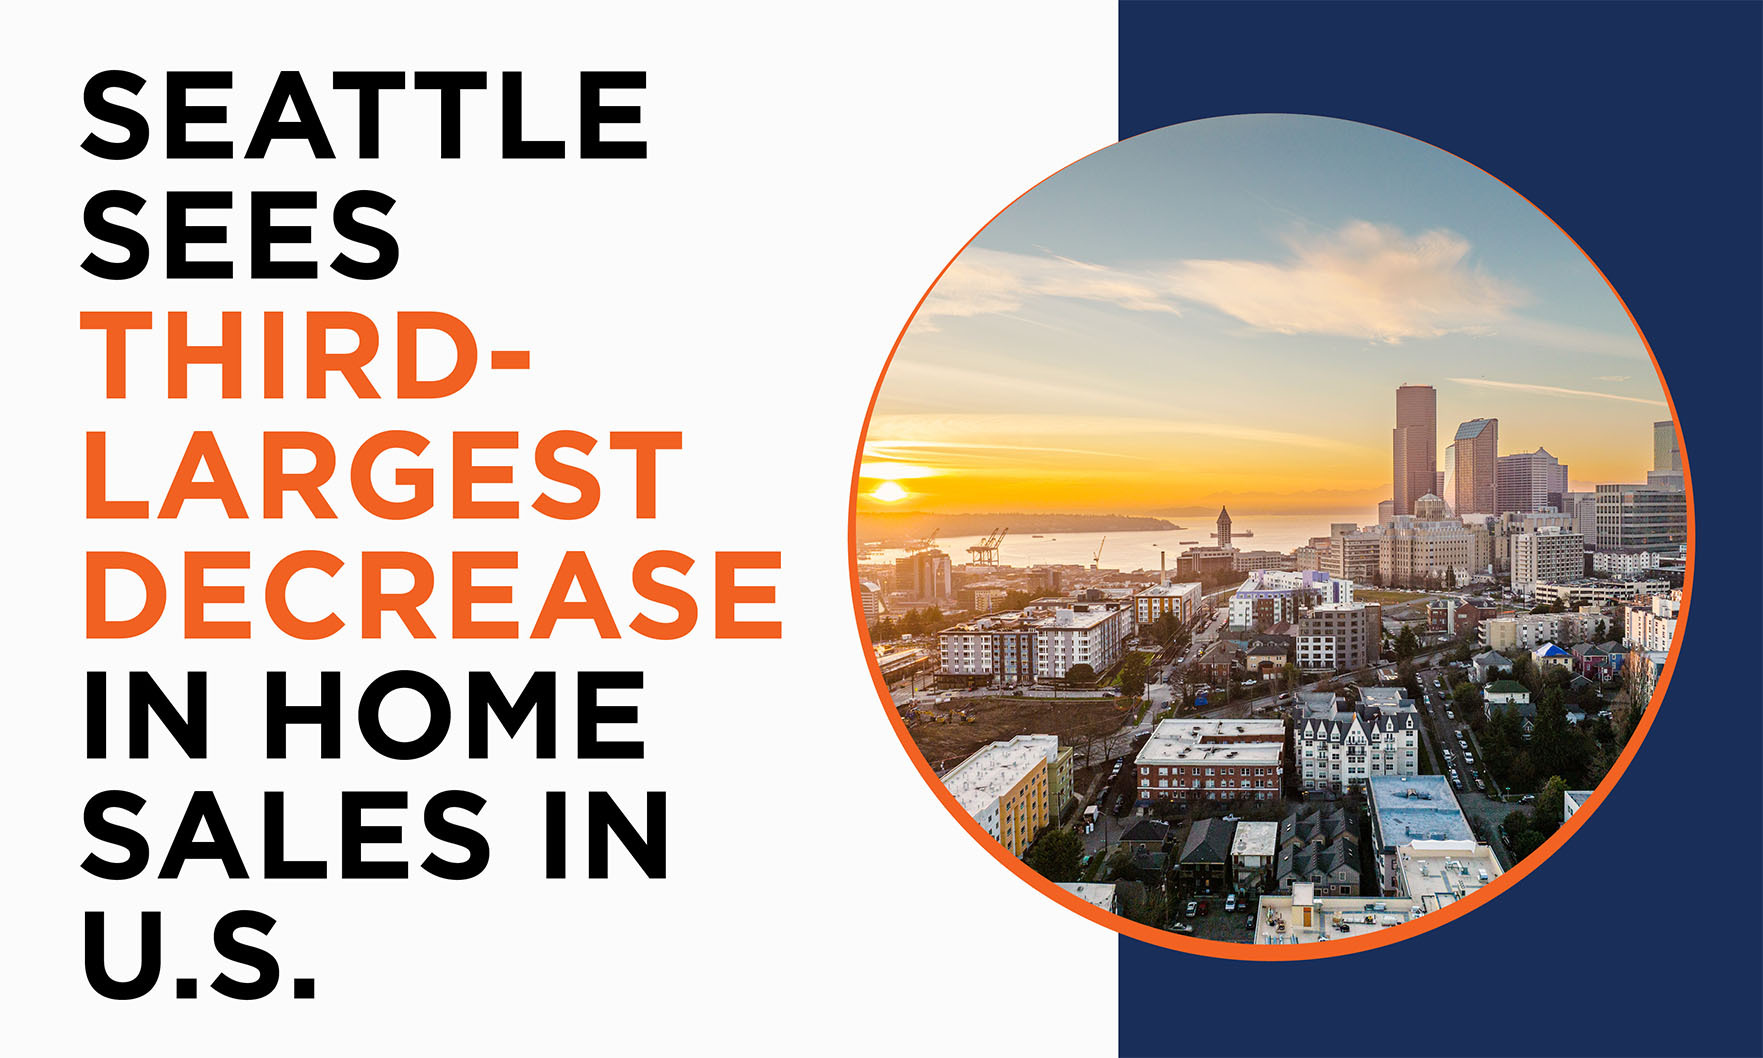
The area also saw some of the biggest year-over-year decreases in new listings and median sales price.
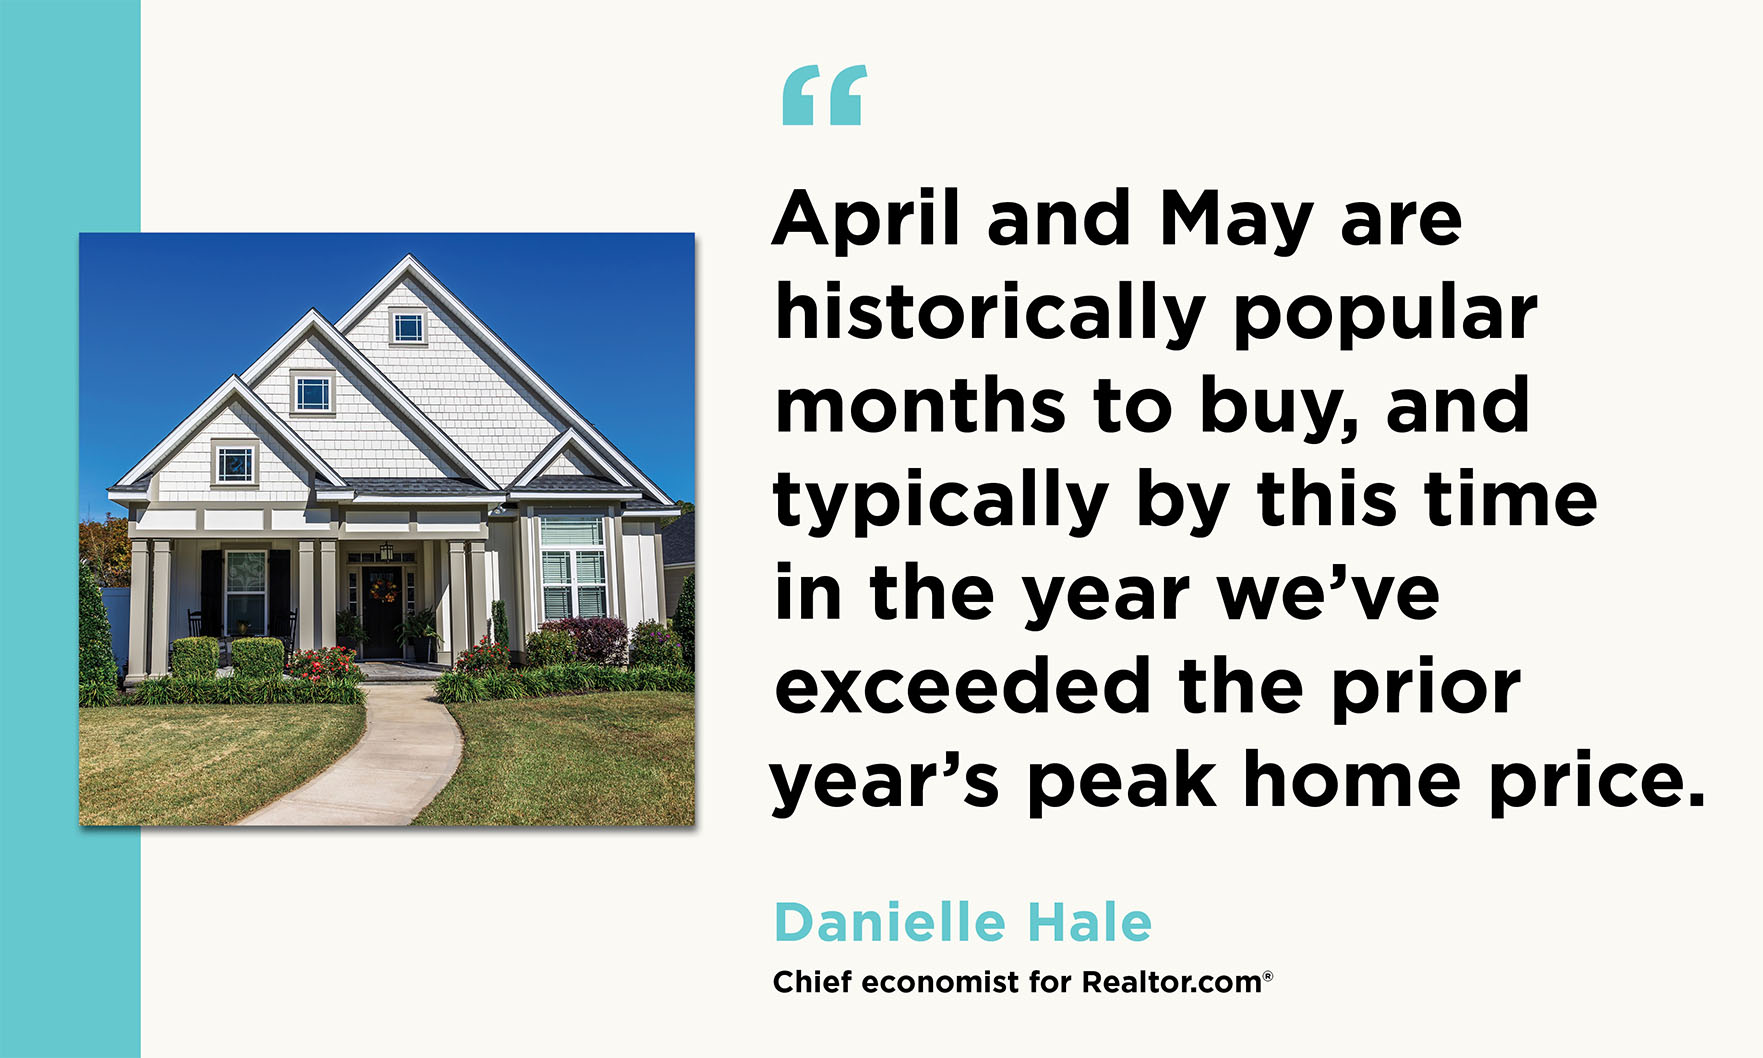
A second consecutive month of increases in the S&P CoreLogic Case-Shiller U.S. National Home Price Index could indicate a reversal of the negative trend that began last year.
Seattle had the third-largest increase in seller concessions from last year.
Despite solid demand, a dearth of homes for sale kept transaction numbers muted in the association’s most recent report on pending sales.

A shortage of existing inventory continues to drive buyers to new construction.

Stunning ocean views are a prominent theme in this past month’s collection of the most expensive luxury listings.
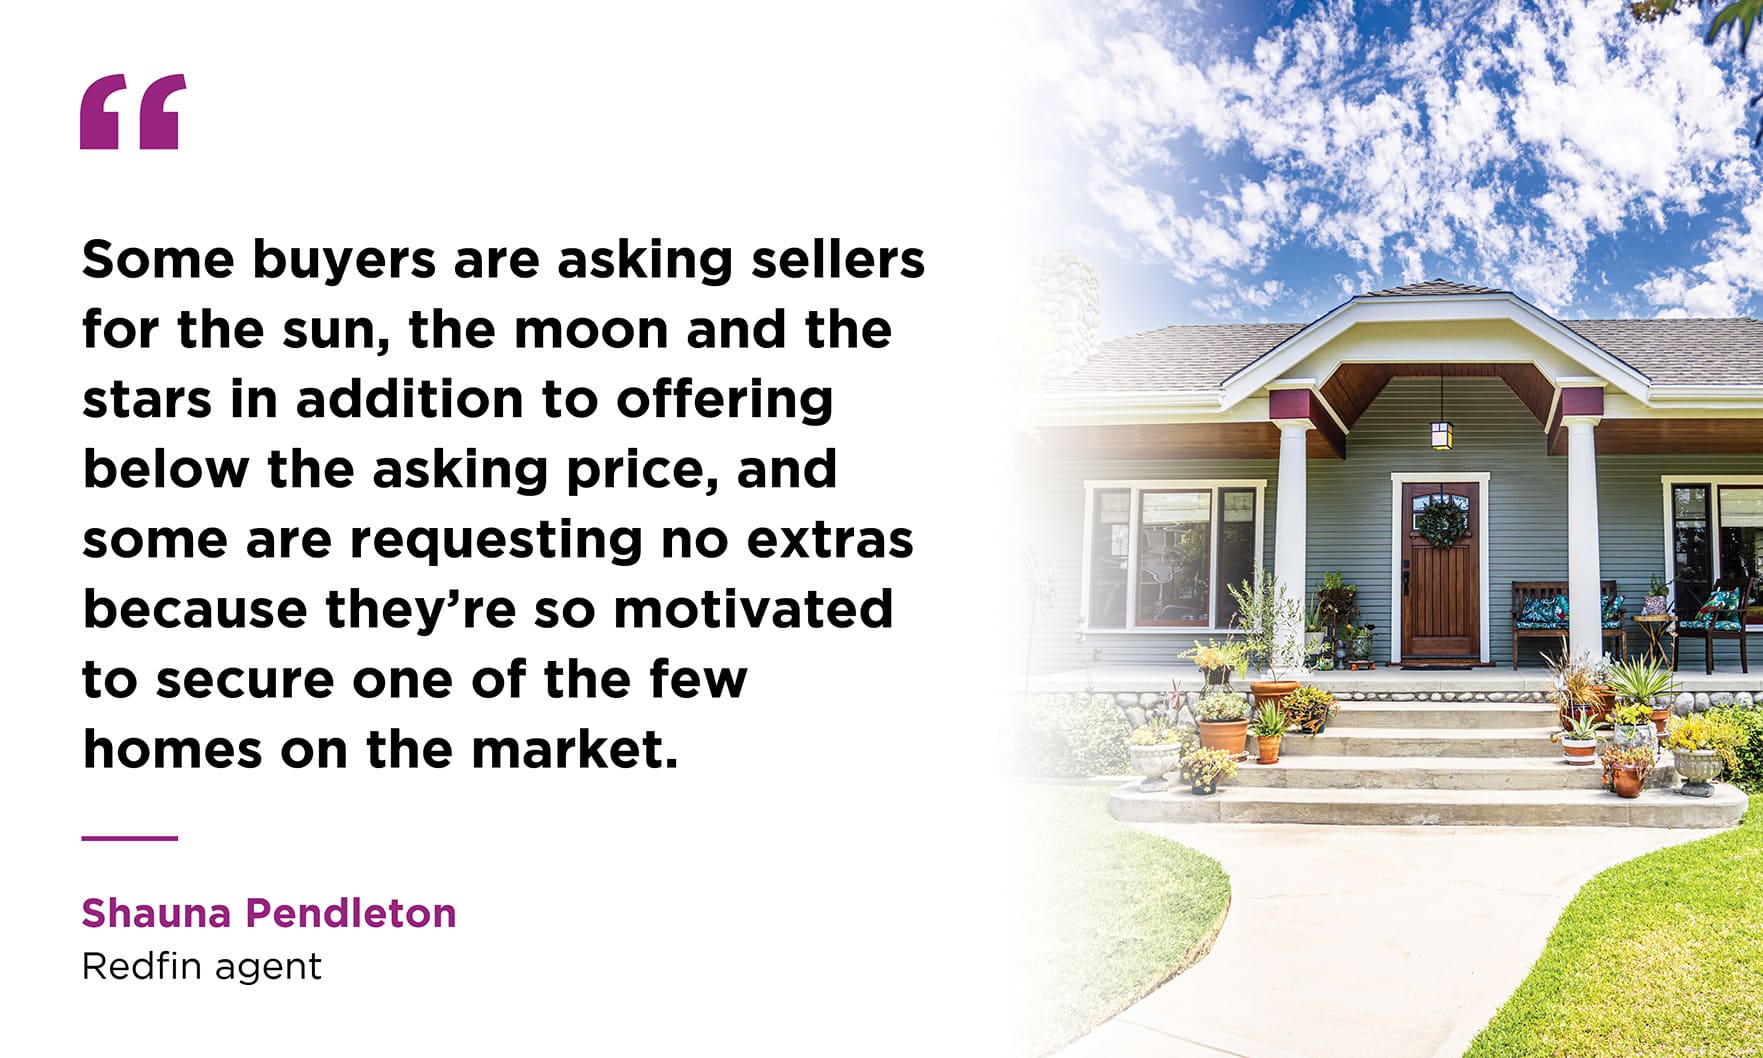
Multiple-offer situations have returned with the spring buying season while distressed and forced sales are “virtually nonexistent,” the National Association of REALTORS® said.
Single-family permits also posted a gain, indicating even more new homes are headed to today’s supply-constrained housing market.

Homebuilder optimism was buoyed by continued shortages of new housing inventory, the National Association of Home Builders reported.
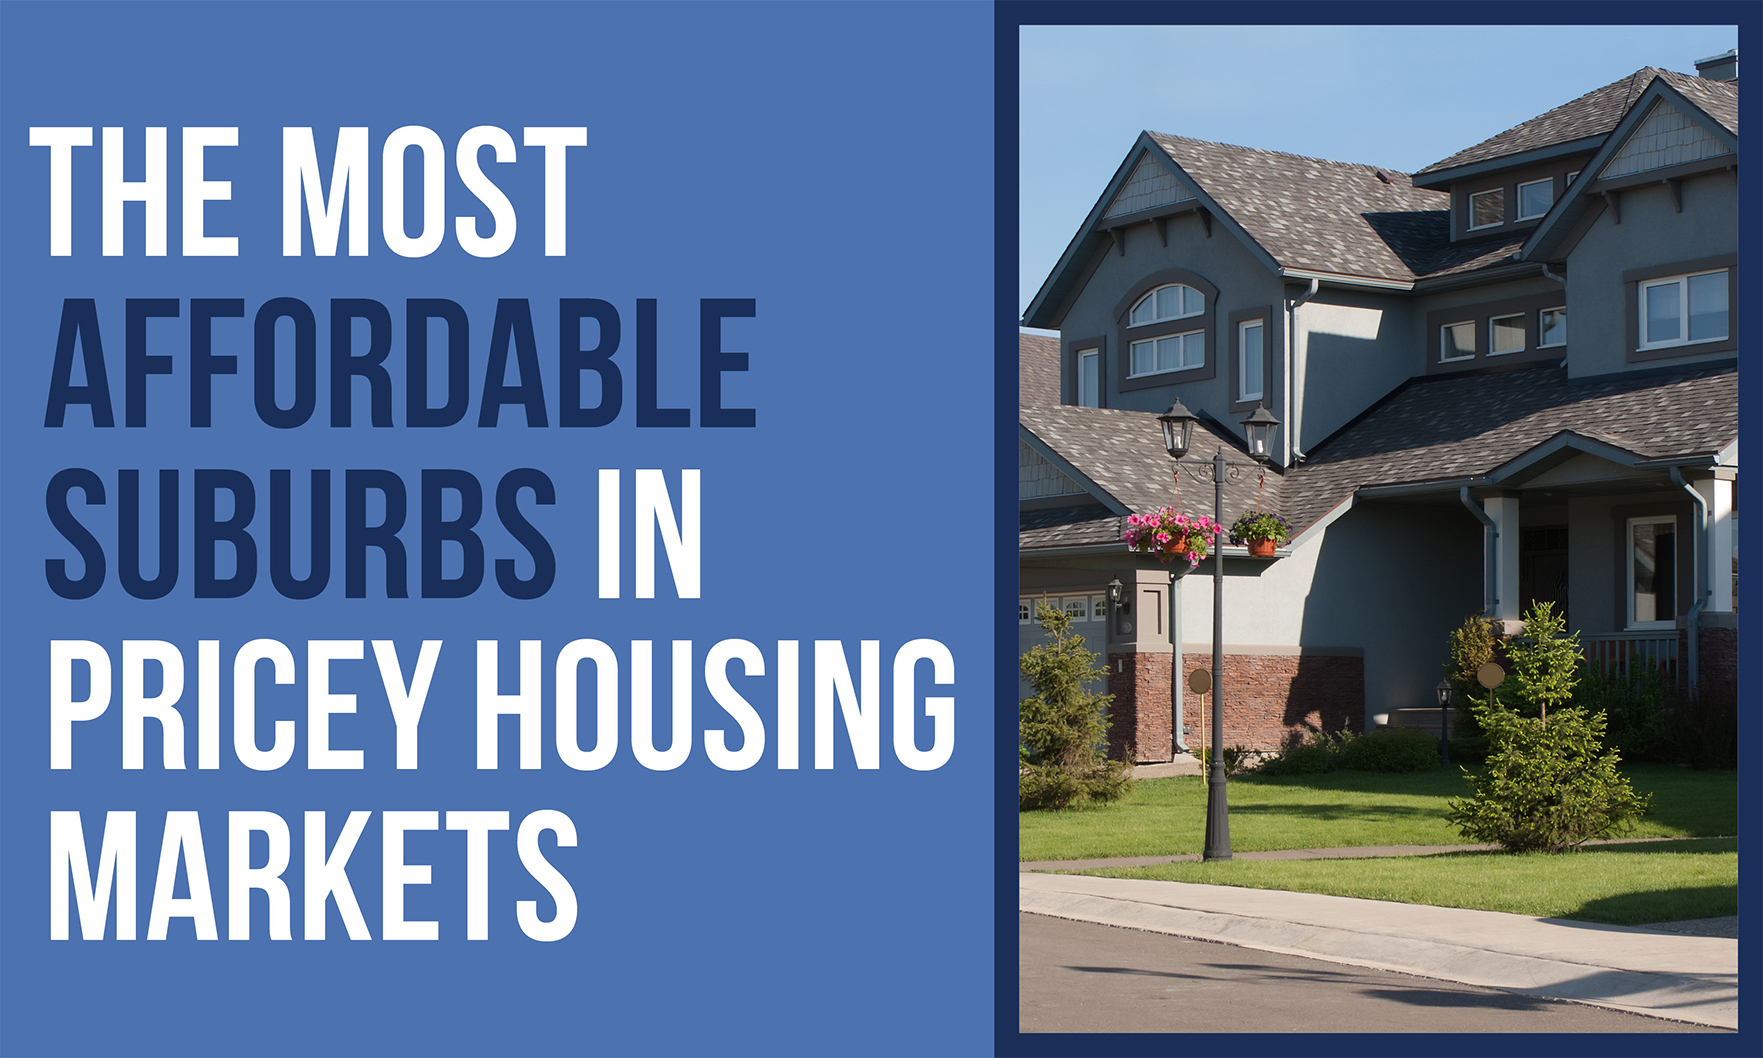
Boulevard Park, with a population just over 5,000, has a median price per square foot of $222, a 61% difference compared to Seattle.
Seattle’s April average home value and pending sales rose from March as new inventory fell.