By the Numbers

The decline in mortgage rates prompted an uptick in refinancing, with government refinances increasing more than 20% over the week, MBA associate vice president of economic and industry forecasting Joel Kan said in a press release.
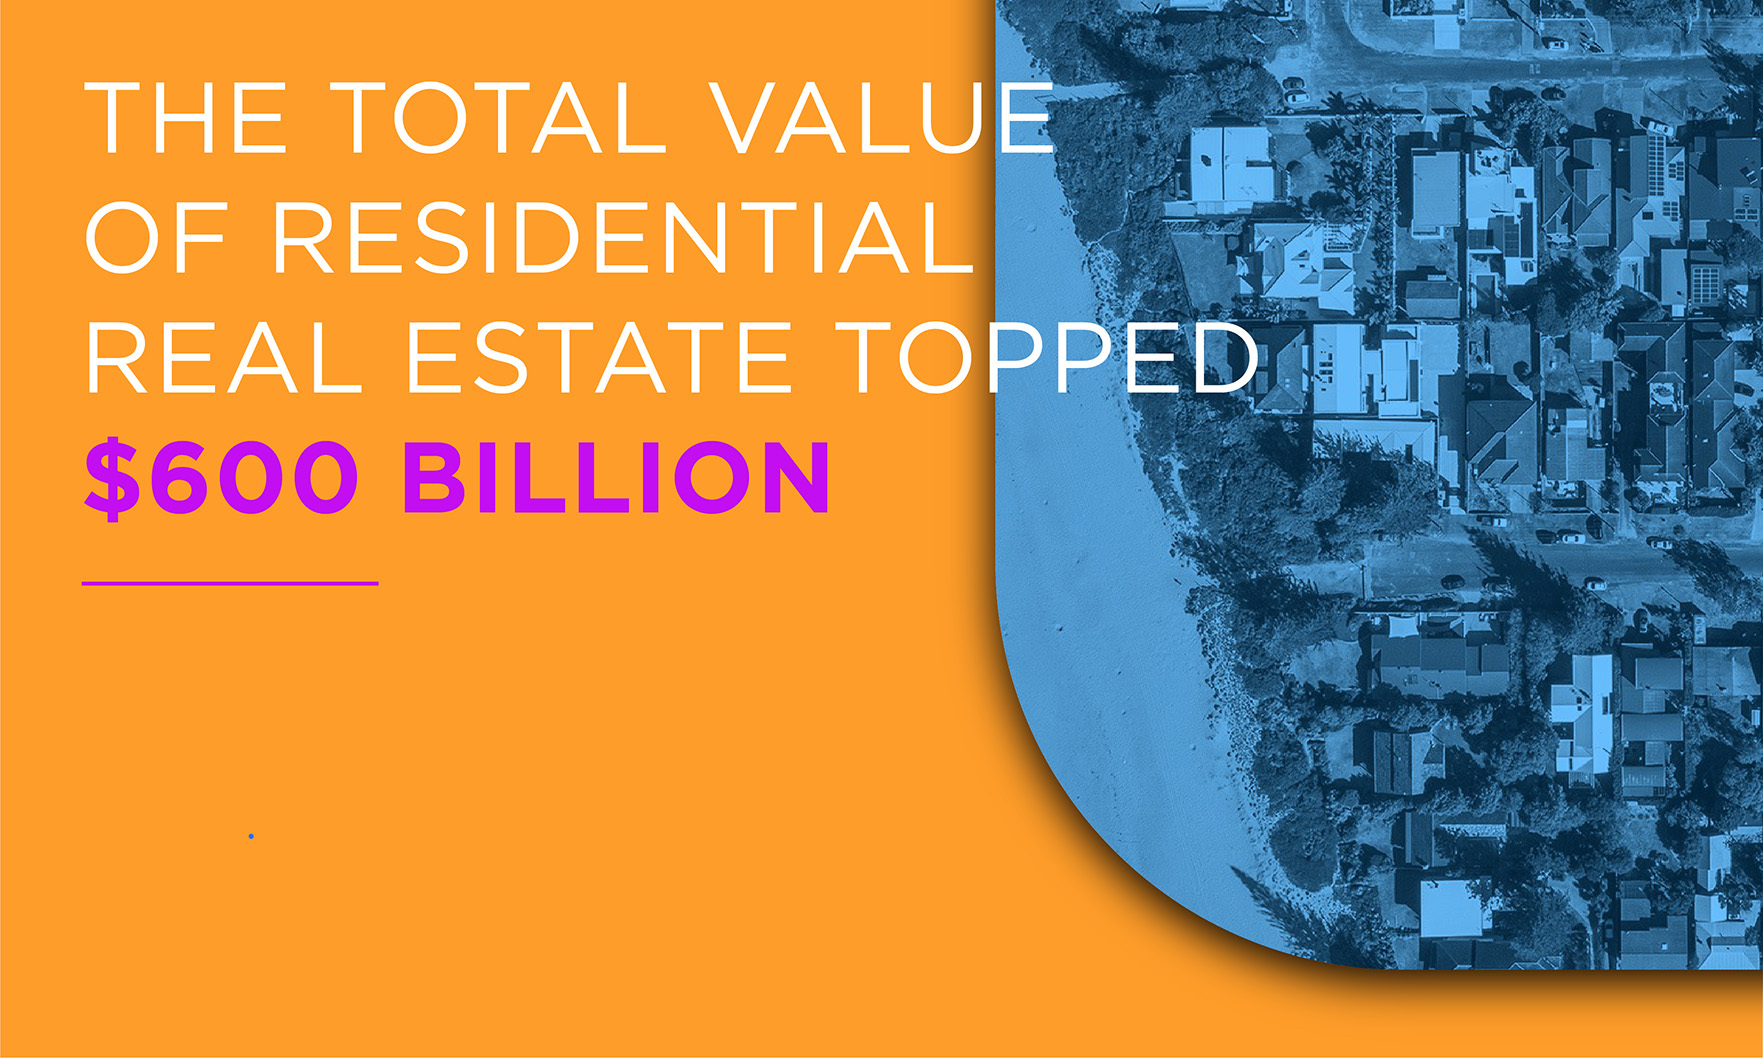
As more money is being spent on real estate than ever before, the booming market is on pace to shatter records this year, according to a recent CoreLogic report.
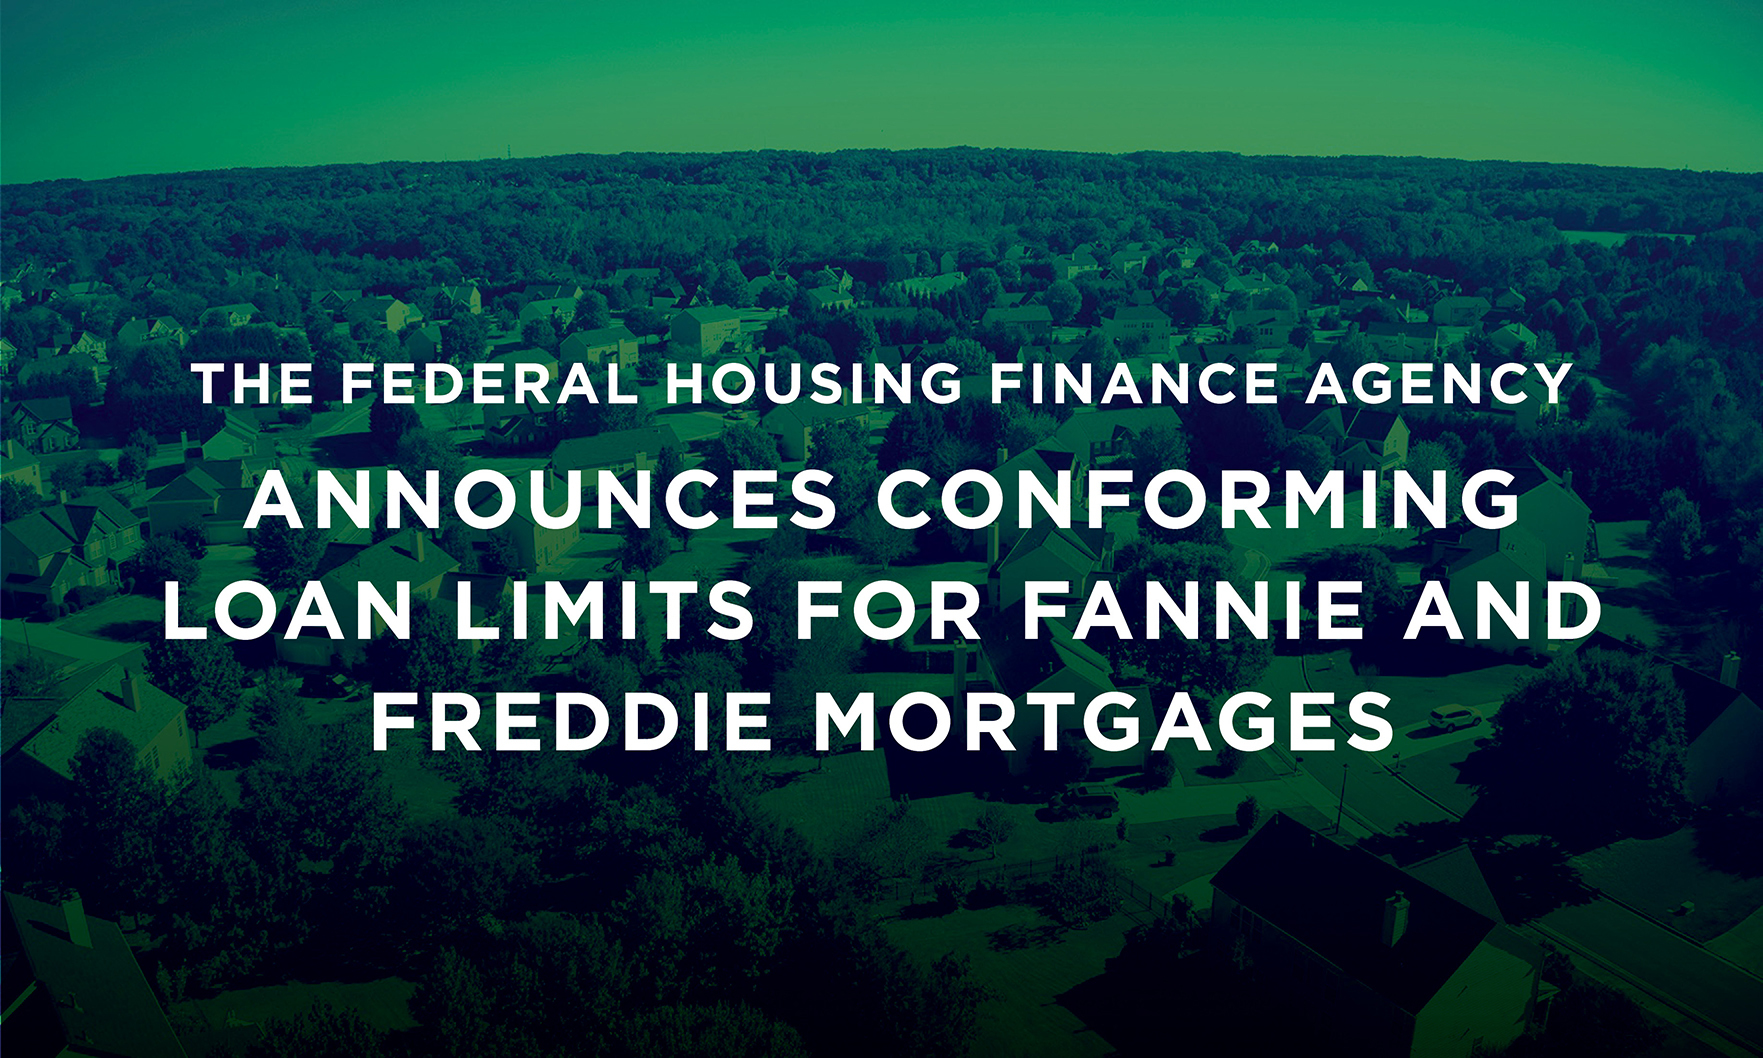
The Federal Housing Finance Agency (FHFA) recently announced its 2022 conforming loan limits (CLL) for conventional loans acquired by Fannie Mae and Freddie Mac.

“Despite higher mortgage rates, purchase applications had a strong week, mostly driven by a 6% increase in conventional loan applications.” — MBA associate vice president of economic and industry forecasting Joel Kan

Prices of Seattle waterfront homes are steadily rising, particularly in King County, where waterfront property has been historically expensive.
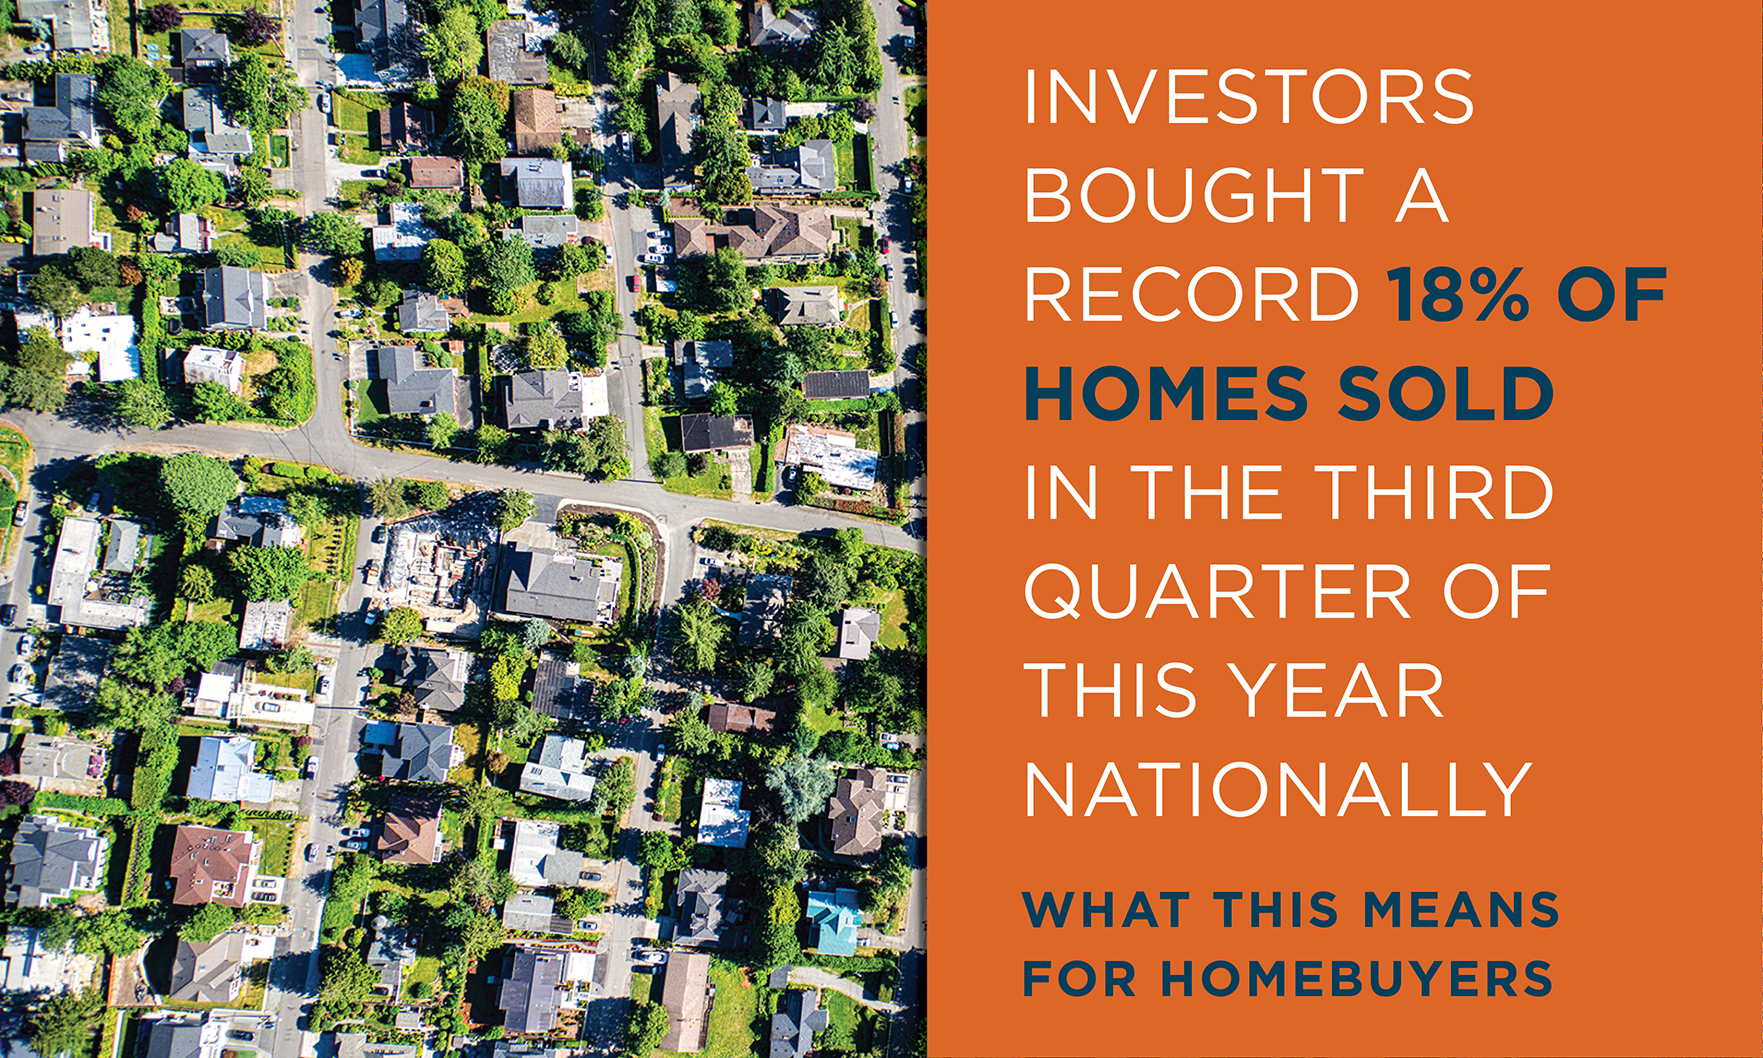
Nationally, investors bought a record 18% of homes sold in the third quarter of this year, and they are increasingly turning to single-family homes, according to Redfin.

“If I had to choose only one word to describe September 2021’s housing price data, the word would be ‘deceleration. Housing prices continued to show remarkable strength in September, though the pace of price increases declined slightly.” — S&P DJI managing director Craig Lazzara.
“Motivated by fast-rising rents and the anticipated increase in mortgage rates, consumers that are on strong financial footing are signing contracts to purchase a home sooner rather than later.” — NAR chief economist Lawrence Yun
The seasonally adjusted estimate of new houses for sale at the end of September was 389,000, representing a supply of 6.3 months at the current sales rate, the U.S. Census Bureau and the U.S. Department of Housing and Urban Development reported.
The U.S. housing market kept firing on all cylinders, as the demand for residential real estate drove prices higher for the 116th month in a row, marking the longest streak on record.
Among the 51 metro areas surveyed in October, closed transactions were down 6.4% from September, nearly twice the average pre-pandemic decline of 3.3% between 2015 and 2019, RE/MAX said, citing its National Housing Report.
November’s reading of 83 was up three points from October, driven by low existing inventories and strong buyer demand, the National Association of Home Builders reported, citing the latest NAHB/Wells Fargo Housing Market Index.
Housing observers noted that demand for housing remains robust despite the lack of new supply.
According to real estate data provider ATTOM, foreclosure filings, which include default notices, scheduled auctions or bank repossessions, rose 5% in October on a monthly basis and 76% from October 2020, to 20,587 filings.
Seventy-eight percent of the 183 U.S. markets monitored by the National Association of Realtors had double-digit increases in their median home prices, a decline from the second quarter, when 94% of markets saw double-digit increases.
“Mortgage rates decreased for the first time since August, as concerns about supply-chain bottlenecks, waning consumer confidence, weaker economic growth and rising inflation pushed Treasury yields lower.” — MBA associate vice president of economic and industry forecasting Joel Kan