Current Market Data

Also during the month, the median sales price rose to $390,500 from $370,200 in June, according to the U.S. Census Bureau and the Department of Housing and Urban Development.

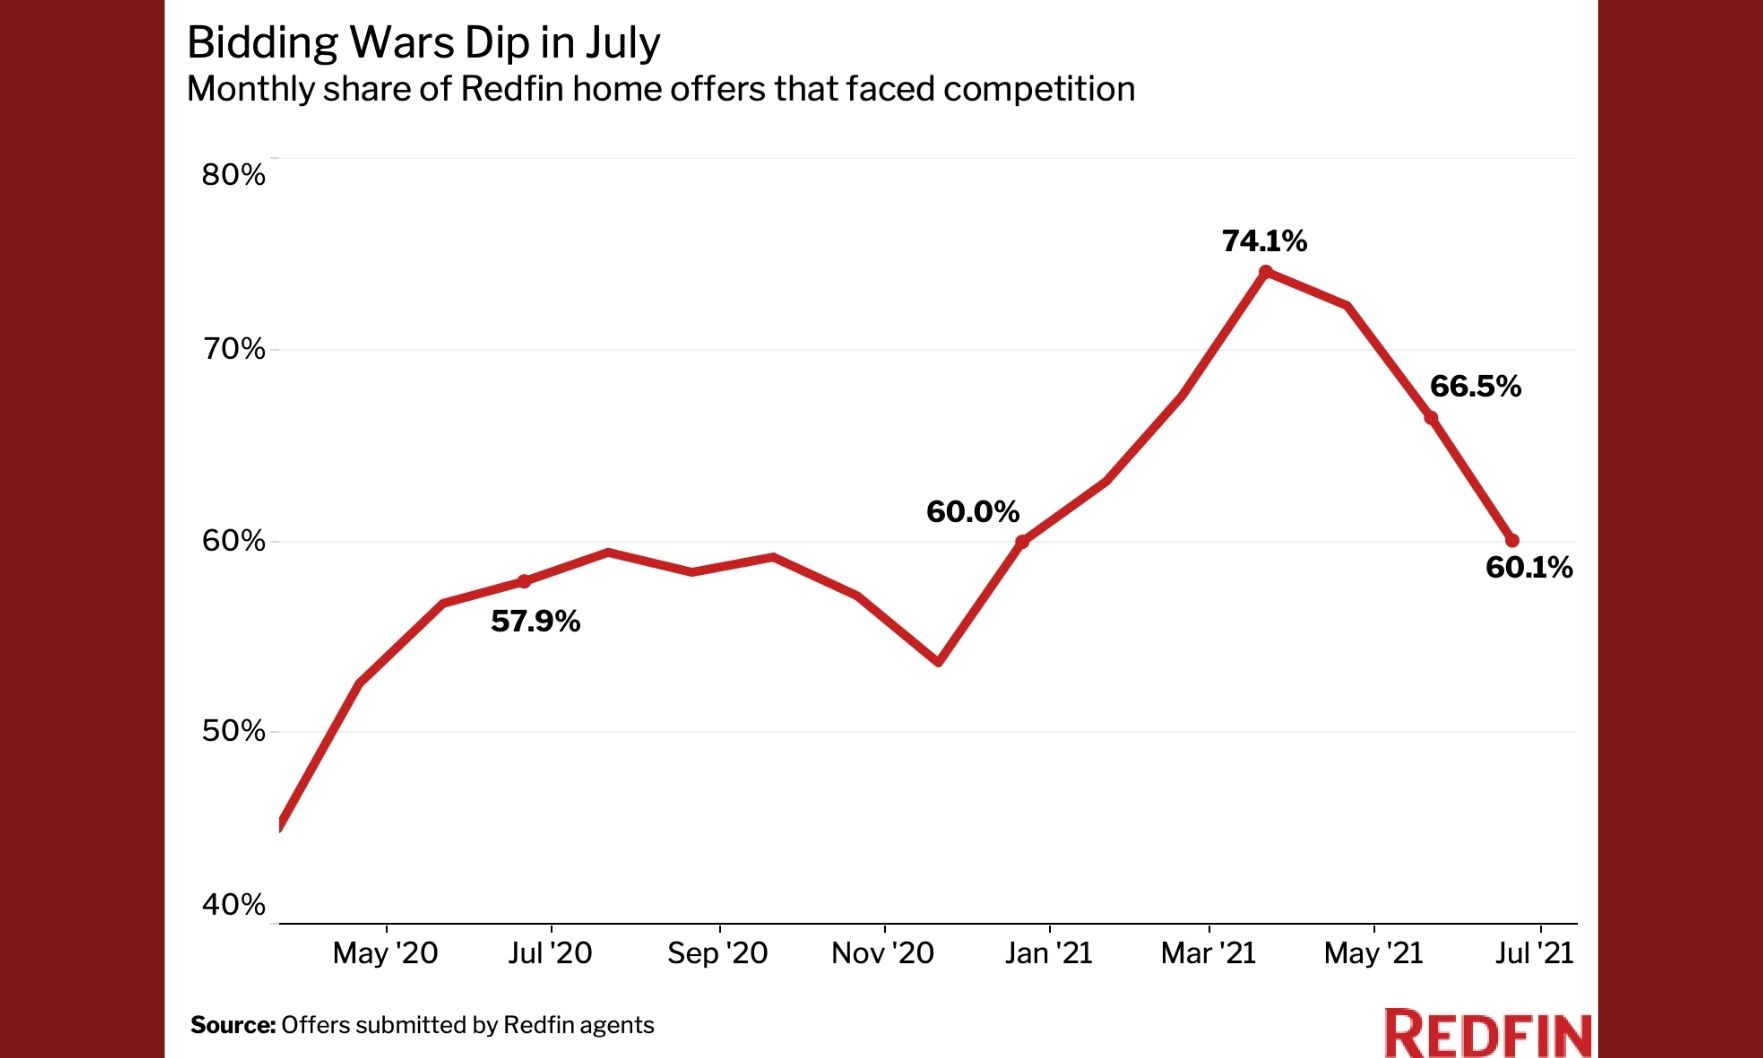
In what’s been a historic, frantic market, homes selling for large sums over list prices have risen sharply since January.

You might be surprised by the results of this survey.
“The bright spot in an otherwise underwhelming report comes from the increase in the overall number of permits issued, which can signal how much home construction is in the pipeline.” — First American deputy chief economist Odeta Kushi
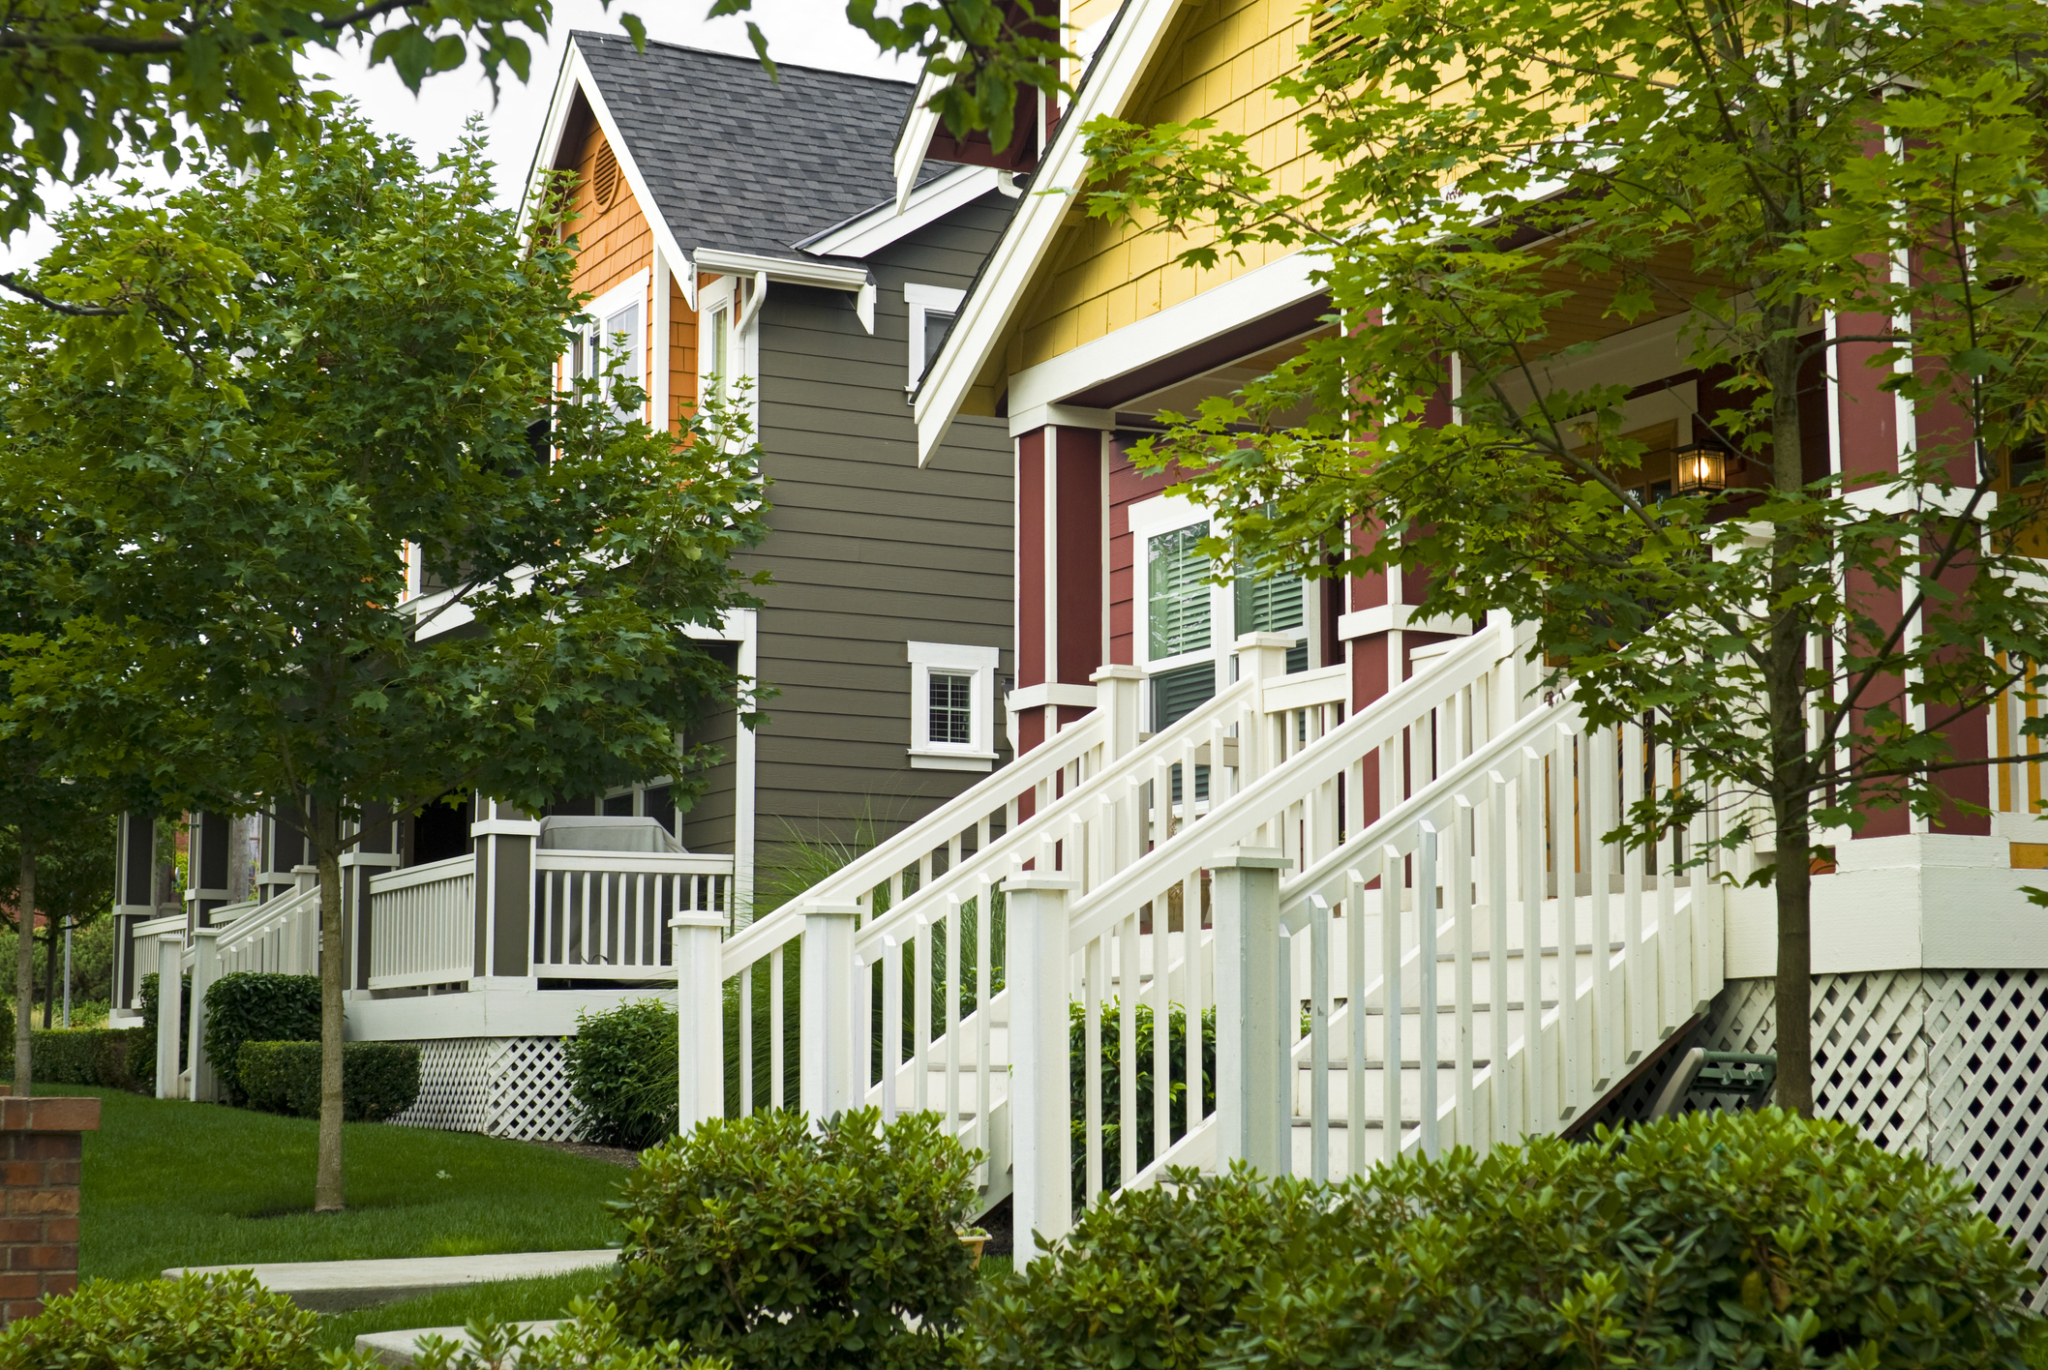
Following months of sky-high prices paired with manic competition — driven by limited supply — the frenetic housing market is starting to cool down. Somewhat.
Smaller, more affordable homes are hitting the market, helping moderate median list prices, according to Realtor.com.
For the first time since early March, no new records were set for median-home-sale prices last month, ending the five-month streak of record-breaking home prices.
Just 56.6% of homes sold during the quarter were affordable to families earning the U.S. median income of $79,900, according to the National Association of Homebuilders/Wells Fargo Housing Opportunity Index.
Affordability declined in 49 of the 50 major markets according to the May 2021 First American Real House Price Index.
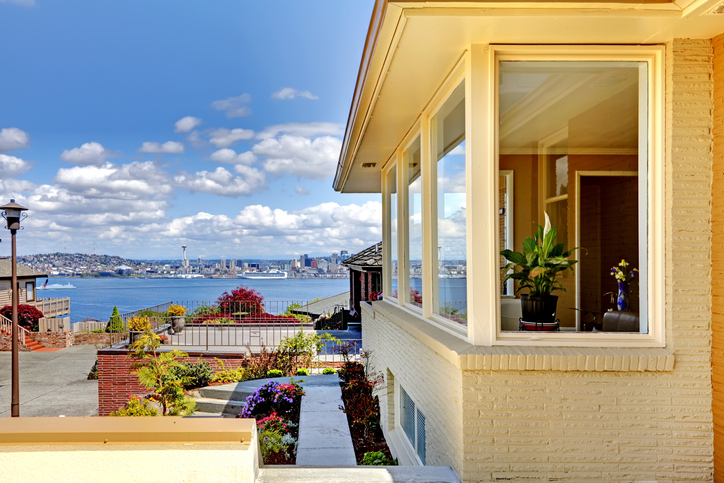
The nationwide housing inventory shortage that has driven growth in prices and demand in Seattle and other major markets may be beginning to ease, according to RE/MAX’s National Housing Report for June.

With the increased number of professionals working remotely, today’s homebuyers are putting less of a premium on commute time and more on affordability.
The U.S. Census Bureau and the Department of Housing and Urban Development reported that the median sales price slid to $361,800 from $380,700 in May.

At the same time, the median existing-home price for all housing types in May was up 23.4% on an annual basis, as every region in the country registered price increases.

Meanwhile, the seasonally adjusted purchase index declined 6% from the previous week, the Mortgage Bankers Association reported.
Privately owned housing units authorized by building permits in June came in at a seasonally adjusted annual rate of
1,598,000, down 5.1 % from the revised May rate of 1,683,000, but 23.3% above the year-ago rate of 1,296,000.
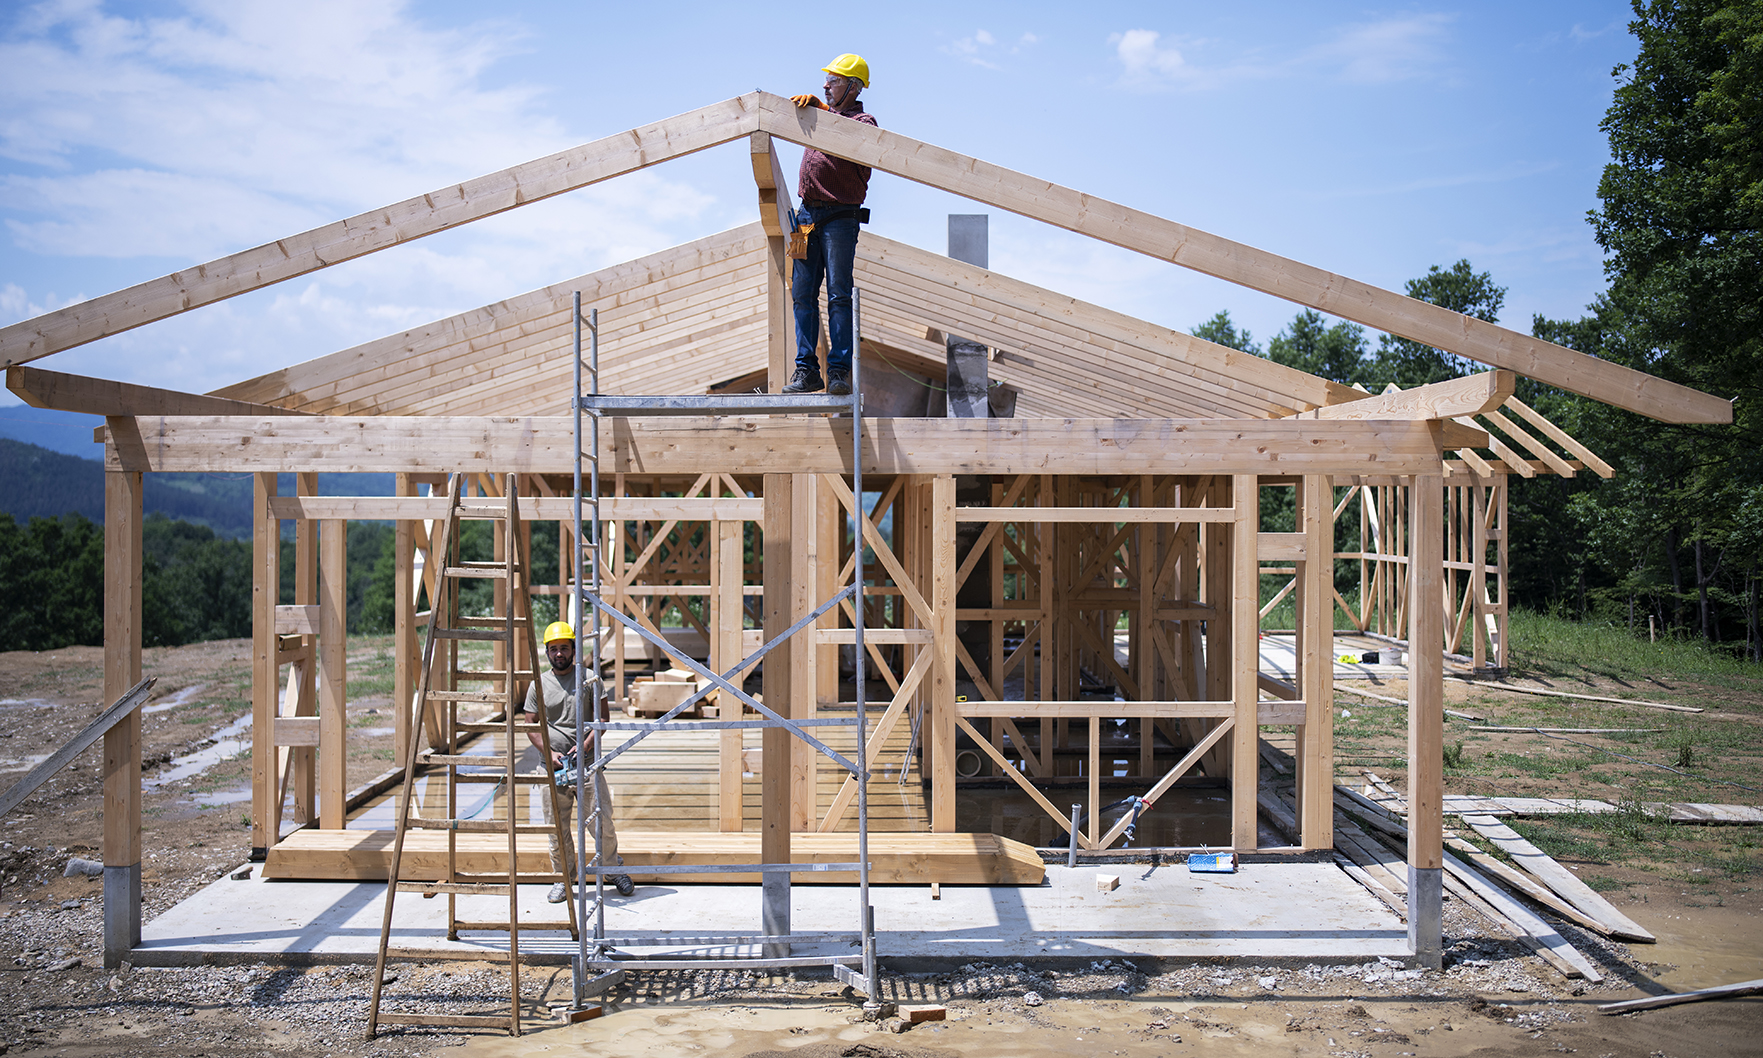
July’s reading of 80 was down one point from June, but still signaled strong demand for housing, the National Association of Home Builders said.