The annual review from the Northwest Multiple Listing Service (NWMLS) reveals that new listings, sales and prices all increased annually in 2024.
New listings in 2024
Realtors added 93,077 new listings to the MLS last year, with an average of 7,756 new listings per month. That’s up 14.05% from 2023, when 81,612 new listings were added to the market, but down significantly from the historic high of 117,948 new listings in 2021.
The most new listings were seen in May, when 11,572 properties were added to the market, a 25.14% increase year over year. Large annual increases were also seen in April (up 31.95%), October (up 25.95%) and February (up 24.51%).
New listings increased annually in every month of the year, with the lowest year-over-year bump occurring in January; new listings rose only 0.59% that month with 4,954 properties added across all counties.
Furthermore, new listings increased annually in every county in the NWMLS region in 2024 with King County leading the pack. Realtors there added 33,414 properties to the MLS, a 17.49% increase from 2023. King was followed by Pierce County and Snohomish County. Pierce County had 13,531 new listings, a 12.1% increase, and Snohomish County had 12,522 new listings, a 14.64% increase.
Across the region, active listings were highest in September, when 15,748 properties were on the market, a 31.42% increase year over year. Conversely, the least active listings occurred in January, when just 7,084 properties were on the market, a 13.82% decrease. January was the only month of the year when active listings fell annually.
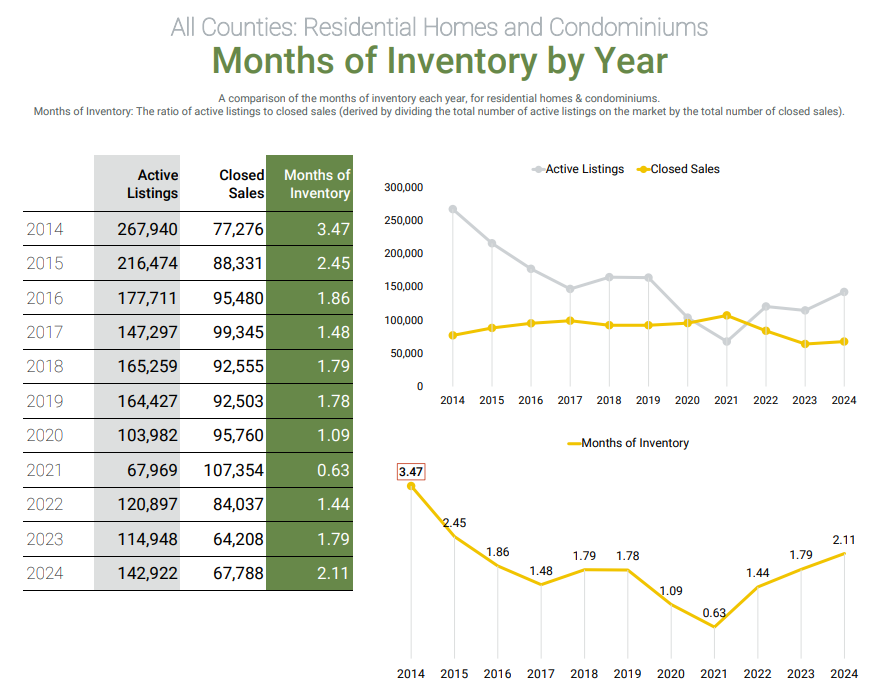
Throughout the year, the region had an average housing supply of 2.11 months, up from an average of 1.79 months in 2023. Months of supply were highest in September at 2.7 months and lowest in March at 1.57 months. The NWMLS region hasn’t had a “balanced market” — meaning a housing supply of four to six months — for over a decade. 2021 marked the lowest annual supply with just 0.63 months, when yearly closings outnumbered active inventory by about 40,000 sales.
Sales and prices in 2024
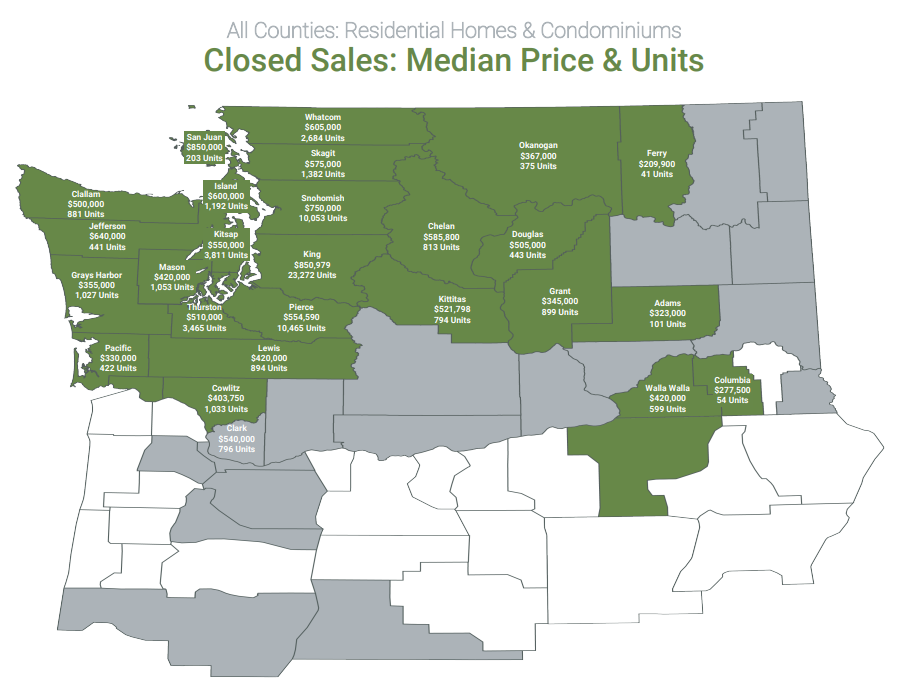
When it comes to sales, the median closed price for all 26 counties in the NWMLS region was $640,000 — the highest yearly median price ever recorded. That includes 67,788 sold single-family homes and condominiums, which had a total dollar value of over $54 billion. In 2023, the median closed price was $600,000 across 64,208 sales. That means, year over year, the median price increased 6.67%.
Across all counties, the median price hit a yearly high of $651,000 in April and a yearly low of $593,500 in January.
Zooming in on the Puget Sound area, the highest prices were seen in King County, which had a median price of $850,979 across 23,272 sales, followed by San Juan County with a median price of $850,000 across only 203 sales. Snohomish County had a median of $750,000 across 10,053 sales; Island County had a median of $600,000 across 1,192 sales; Pierce County had a median of $554,590 across 10,465 sales; and Kitsap County had a median of $550,000 across 3,811 sales.
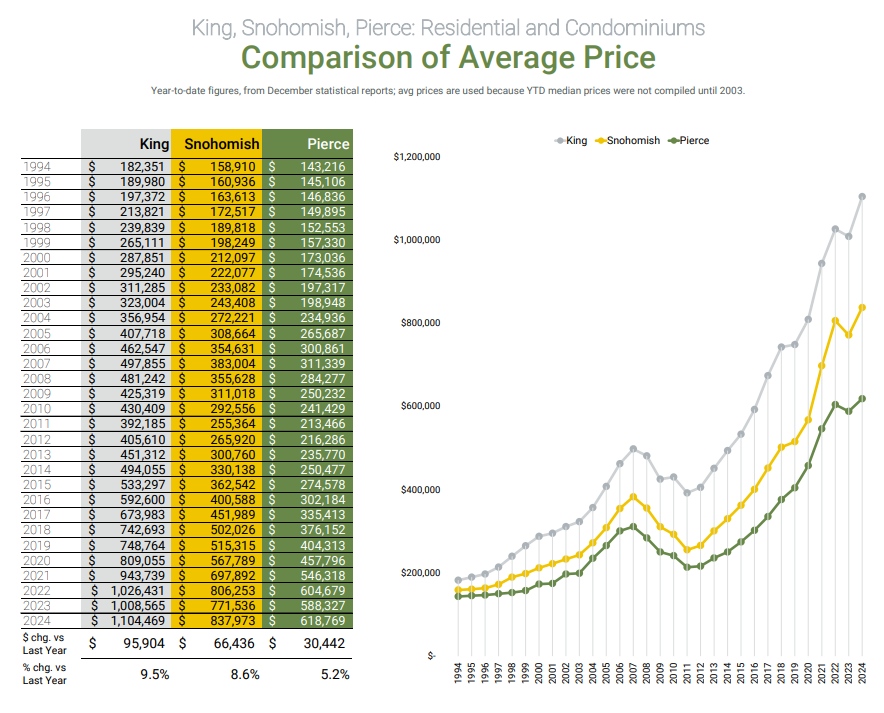
The average sales price also increased in the three largest counties around the Seattle area. In King County, the average rose 9.5% year over year to $1,104,469 (an increase of $95,904). In Snohomish, it rose 8.6% year to $837,973 (an increase of $66,436). In Pierce, it rose 5.2% to $618,769 (an increase of $30,442).
Meanwhile, across the NWMLS region, the sales price-to-list price ratio was 100.2%, meaning the typical home sold for just a bit over asking price. That ratio was highest in April, at 101.6%, and lowest in December, at 99.2%. Homes were most likely to sell over asking price in King County, which had a ratio of 101.4% for the year.
New construction accounted for about 14.2% of sales in 2024, and new single-family homes had a median price of $724,990. New condos had a median price of $837,995. King County posted the most new construction with 3,210 new homes and condos added during 2024 with an average price of $1,249,755 and a median price of $920,450.
Overall, closings were highest in August, when 6,727 properties sold, although that figure was down 0.1% year over year. The greatest annual increase in home and condominium sales was in November, when sales rose 24.71% year over year. Year over year, closings rose 5.8%.


