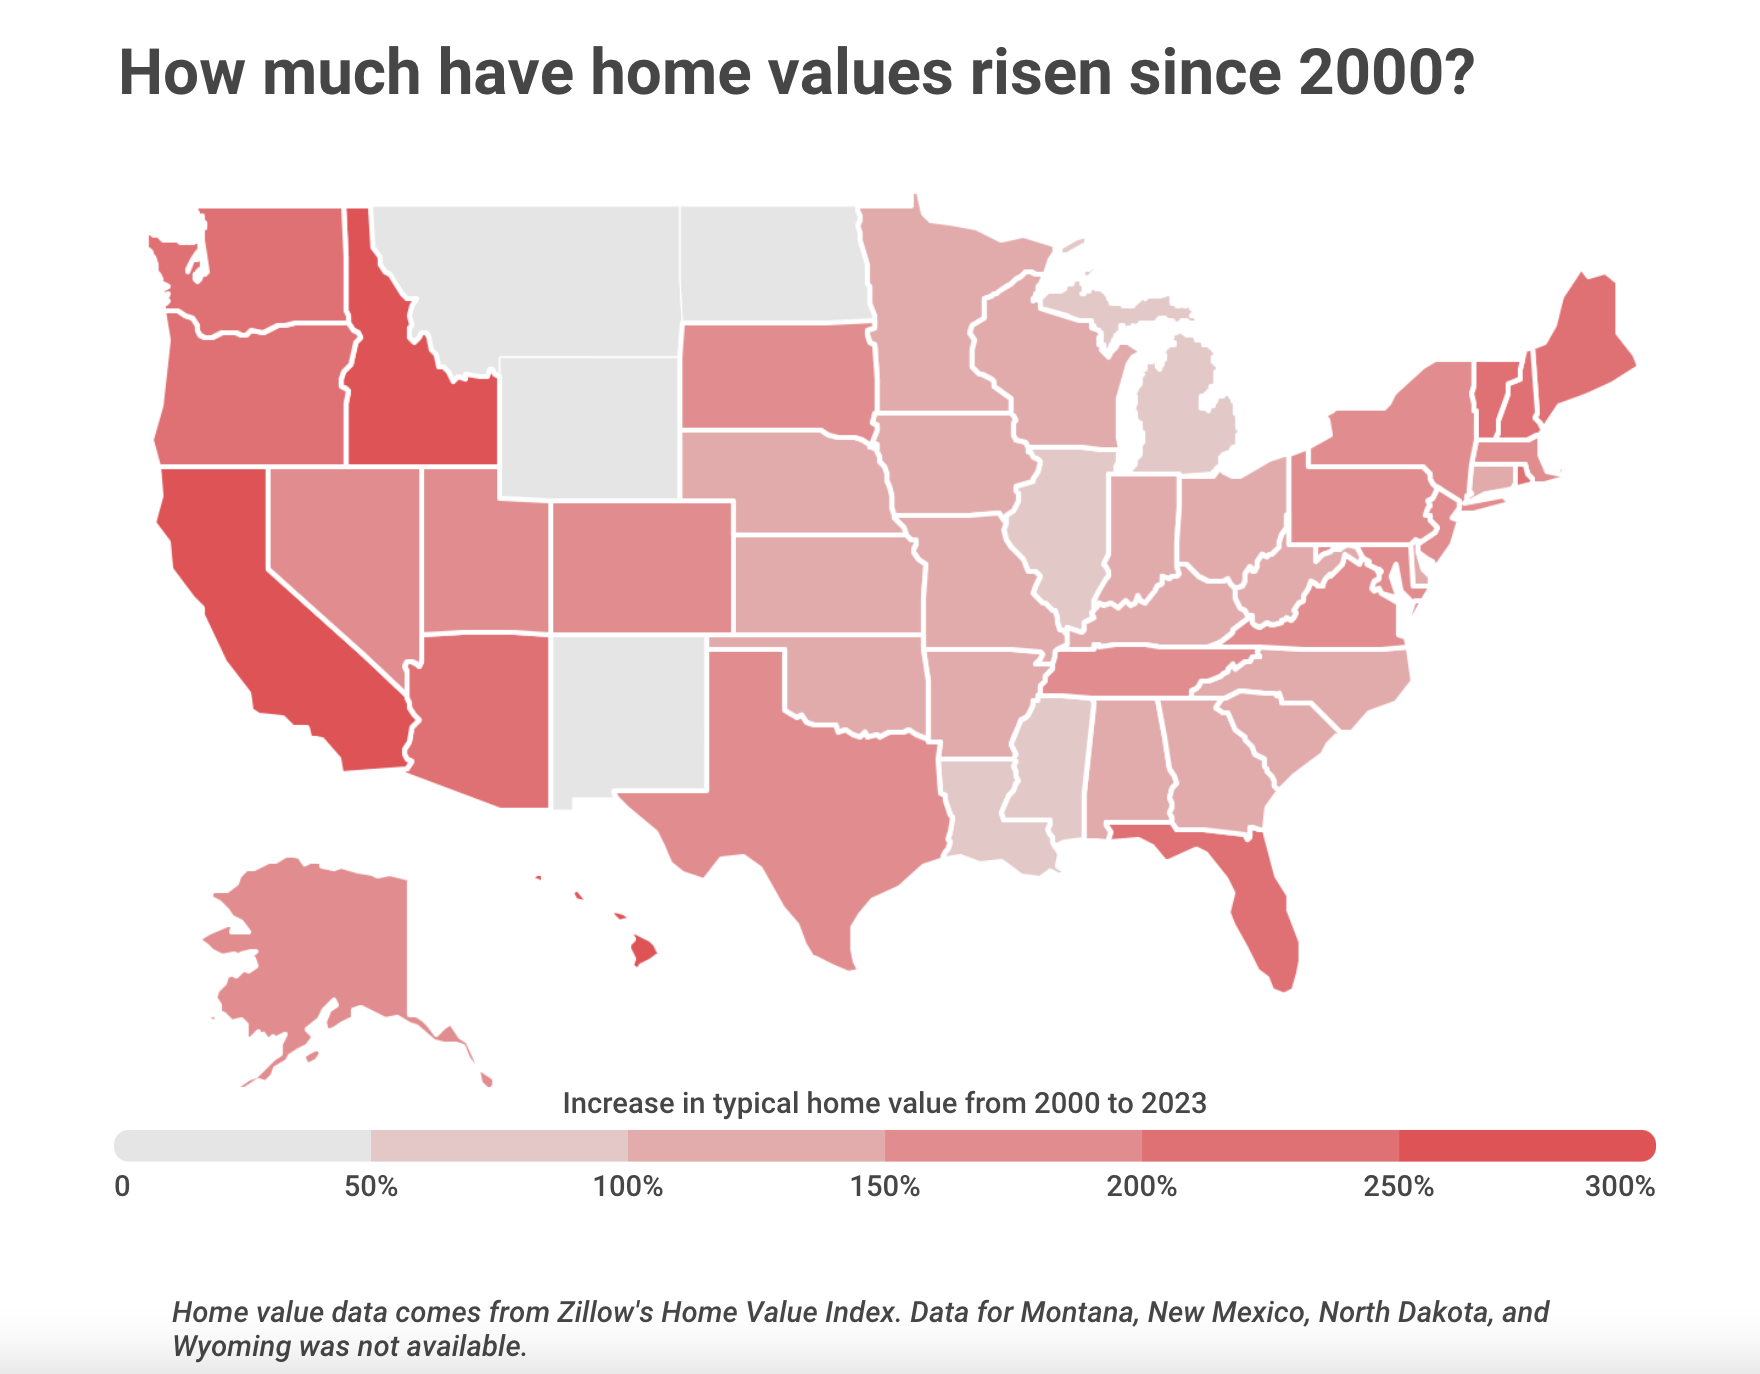
U.S. home prices are 24 times higher than they were in 1963 — while overall inflation is just 10 times higher. This means home prices have outpaced inflation by more than twice over. And that trend has held true over the last decade, too.
Since 2013, inflation has risen 31% and the median home price rose 63%, increasing from $264,800 to $431,000.
In Washington, home prices have risen 216% since 2000 alone. In Seattle, they’ve risen 206%.
These numbers come from a Clever Real Estate report which considers national, home prices over time based on data from the Federal Reserve, the Bureau of Labor Statistics’ CPI Consumer Price Index (CPI), which tracks inflation taking housing costs into account, and the Zillow Home Value Index.
Meanwhile, as most Americans know, income has not increased as quickly. In the 1980s, it took about 3.5 years’ worth of household income to purchase the median home. Today, it takes 6.3 years’ worth of household income. The spike has been especially prominent since 2019.
According to Clever Real Estate, in 2019, the median household income was $68,700 and the median home price was $318,400, resulting in a home-price-to-income ratio of 4.6.
In 2022, the last year for which that ratio is available, it was 6.3. That was based on a median household income of $74,580 and a median home price of $468,000.
However, in 2022, the home-price-increase-to-CPI-increase was negative for the first time.
The following year also marked a reversal for some of national trends. In 2023, for the first time in 12 years, inflation rose faster than home prices, increasing 3.3% while the median home prices decreased by .07%.

